,
39 tweets,
8 min read
Read on Twitter
I have heard many stupid questions in my time. Yet without exception, none is ever prefaced by, "This may be a stupid question, but ..."
So rest assured, Aoife, your question is excellent!
So rest assured, Aoife, your question is excellent!

Before I answer, Aoife, let me just show you a truly stupid question, so you can compare and contrast.
Note that the questionner has puffed himself up to the full 24 atmospheres of hot air.
Note that the questionner has puffed himself up to the full 24 atmospheres of hot air.
We have several times told him that 94-96% of the patients in ORBITA had one OR MORE positive ischemia tests at randomization, but he continues to prattle like a half-wit.
_THIS_ is a stupid question, par excellence.
Read and laugh.
_THIS_ is a stupid question, par excellence.
Read and laugh.

Note to Rasha.
Stop whining. I haven't mentioned anyone by name. Nobody knows who I am talking about, unless they look at the image and deduce it somehow. I didn't type in any name, or an anagram thereof, so leave me alone.
Stop whining. I haven't mentioned anyone by name. Nobody knows who I am talking about, unless they look at the image and deduce it somehow. I didn't type in any name, or an anagram thereof, so leave me alone.
Back to Aoife's question:

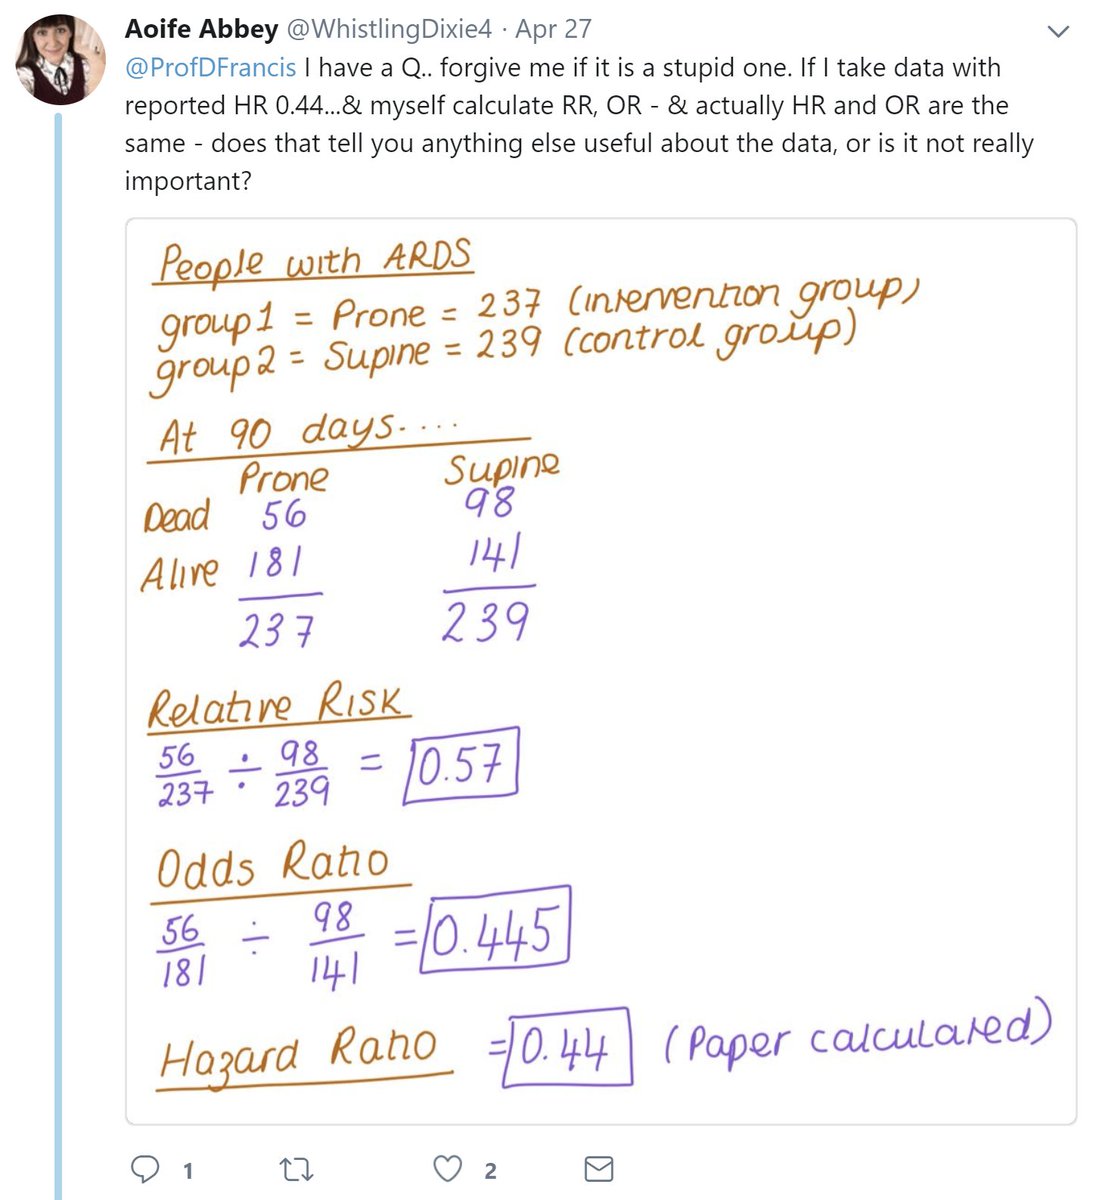
The hazard ratio is in a way the best thing we could calculate, because it looks along every instant in TIME and compares the rate in one group versus the other, and then calculates the best possible scaling of the danger levels in one group versus the other to make them similar.
As readers of the paper we CAN'T calculate hazard ratio for ourselves, because we only have the number of events at the END, not the detail of when they happened.
So we can only do Odds, Risk, and their ratios.
So we can only do Odds, Risk, and their ratios.
Suppose we have a certain hazard ratio between Rasha and me doing pacemakers.
I have a certain rate of complications.
Rasha's is HALF mine.
(Obviously this is only a thought experiment, and I am actually MUCH better than her at everything, because I am a professor etc).
I have a certain rate of complications.
Rasha's is HALF mine.
(Obviously this is only a thought experiment, and I am actually MUCH better than her at everything, because I am a professor etc).
Let's imagine a patient keeps disco dancing the day after the implant, and the lead keeps dislodging.
So every day they need a procedure to rejiggle the leads back into some sort of cardiac chamber, rather than the liver.
So every day they need a procedure to rejiggle the leads back into some sort of cardiac chamber, rather than the liver.
First day, 20% of my patients get bleeding from the procedure.
That day, 10% of Rasha's are bleeding-free.
What is my freedom-from-bleeding rate (let's call it "doing fine" rate)?
That day, 10% of Rasha's are bleeding-free.
What is my freedom-from-bleeding rate (let's call it "doing fine" rate)?
That day, what is Rasha's patients' doing-fine rate?
All the patients we treat go disco dancing that night. Not as good dancers as me, admittedly, but still fairly vigorous.
All their leads get displaced.
Everyone gets another procedure next day.
All their leads get displaced.
Everyone gets another procedure next day.
As I begin that second day, 0.80 of my patients have so far escaped bleeding.
Their probability of escaping bleeding today is also 0.80.
What is the probability of my patients being bleeding free TONIGHT?
Hint. They need to escape bleeding at both procedures, 0.80 x 0.80
Their probability of escaping bleeding today is also 0.80.
What is the probability of my patients being bleeding free TONIGHT?
Hint. They need to escape bleeding at both procedures, 0.80 x 0.80
And how about the patients who go through two days of Rasha procedures, at 0.90 probability each day of doing fine.
What is the probability of still being bleeding free after both days?
What is the probability of still being bleeding free after both days?
What was the HAZARD RATIO on the first day?
What was the hazard ratio on the SECOND day?
In other words, what was the INSTANTANEOUS risk for Rasha's patients, divided by that of my patients?
By instantaneous I mean look at each day in isolation.
What was the hazard ratio on the SECOND day?
In other words, what was the INSTANTANEOUS risk for Rasha's patients, divided by that of my patients?
By instantaneous I mean look at each day in isolation.
Hint, we remain the same people, so she remains (mysteriously) a better operator than me.
So Hazard Ratio for Rasha-versus-Darrel will be the same on the two days.
So Hazard Ratio for Rasha-versus-Darrel will be the same on the two days.
Well, remember I said that Rasha had half the complication rate as me? That is the manifestation of the HAZARD RATIO, i.e. at any instant in time, she is half as likely to be jabbing the subclavian artery as me.
Her hazard ratio is 0.5.
Always.
Every day.
From here to eternity.
Her hazard ratio is 0.5.
Always.
Every day.
From here to eternity.
So hazard ratio (in this thought experiment) stays constant.
Let's see what happens to RISK ratio, shall we?
At 1 day, risk ratio is 0.1/0.2, which is what?
Let's see what happens to RISK ratio, shall we?
At 1 day, risk ratio is 0.1/0.2, which is what?
Now comes the exciting part.
At two days, 0.81 of Rasha's patients are doing fine, but only 0.64 of mine are.
So her RISK ratio is one-minus-that, i.e.
0.19/0.36
Is this more than 0.5, less than 0.5, or exactly 0.5?
At two days, 0.81 of Rasha's patients are doing fine, but only 0.64 of mine are.
So her RISK ratio is one-minus-that, i.e.
0.19/0.36
Is this more than 0.5, less than 0.5, or exactly 0.5?
This is the problem of risk ratios: they are "pulled" towards 1 as risks gradually increase in both arms.
Try it for yourself if you don't believe me. It's 0.5277.
After another day it is this:
lmgtfy.com/?q=(1-.9%5E3)%…)
Try it for yourself if you don't believe me. It's 0.5277.
After another day it is this:
lmgtfy.com/?q=(1-.9%5E3)%…)
I know you don't believe me!
As the days go by, her risk ratio, having started at 0.5, gradually inches up.
By 10 days of repeated operations, the risk ratio under Rasha is 0.73.
Try the numbers and see!
As the days go by, her risk ratio, having started at 0.5, gradually inches up.
By 10 days of repeated operations, the risk ratio under Rasha is 0.73.
Try the numbers and see!
Eventually, her risk ratio becomes almost 1! Awesome! She's no better than me! (I knew it all along, BTW.)
Shown here graphically for 20 days.
X axis is NUMBER OF DAYS of procedures done per patient.
Y axis is RISK RATIO, Rasha - versus - Darrel
lmgtfy.com/?q=plot+(1-0.9…
Shown here graphically for 20 days.
X axis is NUMBER OF DAYS of procedures done per patient.
Y axis is RISK RATIO, Rasha - versus - Darrel
lmgtfy.com/?q=plot+(1-0.9…
Francis's law of risk ratios
=================
If you are a better operator than the other guy, you may be able to show it after one "round" of procedures. But as time goes on and people have more and more procedures sequentially, the RISK RATIO will tend towards 1.
=================
If you are a better operator than the other guy, you may be able to show it after one "round" of procedures. But as time goes on and people have more and more procedures sequentially, the RISK RATIO will tend towards 1.
Francis's addendum.
If you are the other guy, i.e. YOUR risk ratio is >1, e.g. 2, then this works in your favour.
Ask for multiple rolls of the die. Your initial "2" risk ratio will dwindle with time and tend towards 1, given enough goes.
If you are the other guy, i.e. YOUR risk ratio is >1, e.g. 2, then this works in your favour.
Ask for multiple rolls of the die. Your initial "2" risk ratio will dwindle with time and tend towards 1, given enough goes.
Let's try ODDS ratios now
\___________________________/
After first day,
odds for Rasha is 0.1/0.9=1/9
odds for me is 0.2/0.8 = 1/4
The Odds Ratio for Rasha versus me is
\___________________________/
After first day,
odds for Rasha is 0.1/0.9=1/9
odds for me is 0.2/0.8 = 1/4
The Odds Ratio for Rasha versus me is
Hint, the answer is 0.444...
Now let's look after the second day.
Odds for Rasha is 0.19/0.81 = 0.2345...
Odds for me is 0.36/0.64 = 0.5625
Odds ratio Ratio for Rasha versus me, at the end of the second day, is:
Odds for Rasha is 0.19/0.81 = 0.2345...
Odds for me is 0.36/0.64 = 0.5625
Odds ratio Ratio for Rasha versus me, at the end of the second day, is:
As time passes, is the odds ratio
Again, if you don't believe me, try later years.
Her Odds Ratio starts near 0.5, but progressively moves away from it with time.
Here is the graph. Again, the x axis is the number of days (i.e pacemaker procedures) each patient has had.
google.co.uk/search?rlz=1C1…
Her Odds Ratio starts near 0.5, but progressively moves away from it with time.
Here is the graph. Again, the x axis is the number of days (i.e pacemaker procedures) each patient has had.
google.co.uk/search?rlz=1C1…
Yes!
Risk ratio goes TOWARDS 1, as you repeatedly do the thing.
Odds ratio goes AWAY from 1, as you repeatedly do the thing.
The only thing that stays 0.5, is the hazard ratio.
But to calculate that you need the DATES of events (or, equivalently, the shape of the hazard func.)
Risk ratio goes TOWARDS 1, as you repeatedly do the thing.
Odds ratio goes AWAY from 1, as you repeatedly do the thing.
The only thing that stays 0.5, is the hazard ratio.
But to calculate that you need the DATES of events (or, equivalently, the shape of the hazard func.)
And the coup de gras is to plot the graphs, day by day, of:
Risk Ratio
Hazard Ratio
Odds Ratio
on a single graph.
Here we go! Read and weep. Only hazard ratio can stay constant.
wolframalpha.com/input/?i=plot+…
Risk Ratio
Hazard Ratio
Odds Ratio
on a single graph.
Here we go! Read and weep. Only hazard ratio can stay constant.
wolframalpha.com/input/?i=plot+…
So there we have it.
HAZARD ratio is the ideal measure. However, to calculate it, requires the DATES of events. The authors may be able to do, but general readers of a paper (or meta analysts) can't.
ODDS ratio diverges away from 1 with time
.
RISK ratio converges towards 1.
HAZARD ratio is the ideal measure. However, to calculate it, requires the DATES of events. The authors may be able to do, but general readers of a paper (or meta analysts) can't.
ODDS ratio diverges away from 1 with time
.
RISK ratio converges towards 1.
It's all about the numbers. If you are fearful of numbers, people will dance around you and rob you. Don't be afraid, it is easier than it looks.
Closing down for the night but please feel free to ask Qs.
Closing down for the night but please feel free to ask Qs.
Second part of Aoife's question.

All three, hazard ratio, odds ratio and risk ratio, give a confidence interval and a p value.
The key to them being roughly the same is that fewish events had happened (not specifically how many days had passed) but I guess you realise that.
The key to them being roughly the same is that fewish events had happened (not specifically how many days had passed) but I guess you realise that.
"In the long run,
we are all dead,
All our efforts have
a risk ratio of 1, and
an odds ratio of infinity*."
Albert Einstein
J Almost True Statements 2018.
we are all dead,
All our efforts have
a risk ratio of 1, and
an odds ratio of infinity*."
Albert Einstein
J Almost True Statements 2018.
* poetic license
Odds ratios greater than 1 trend upwards towards infinity , while odds ratios smaller than 1 trend towards 0.
Warning. I don't actually know if this is true. It's a bit of a gut instinct guess. Happy to be corrected by an actual statistician etc.
Odds ratios greater than 1 trend upwards towards infinity , while odds ratios smaller than 1 trend towards 0.
Warning. I don't actually know if this is true. It's a bit of a gut instinct guess. Happy to be corrected by an actual statistician etc.