,
13 tweets,
5 min read
Read on Twitter
Thread: an early-warning system for attempts to artificially inflate Twitter traffic and / or game the trending algorithm.
Proud to be published by @oiioxford, with thanks to the illustrious @pnhoward @lmneudert and @polbots.
comprop.oii.ox.ac.uk/research/worki…
Proud to be published by @oiioxford, with thanks to the illustrious @pnhoward @lmneudert and @polbots.
comprop.oii.ox.ac.uk/research/worki…
It's not just bots. Manipulation on Twitter is getting more complex, with more combinations of automated, human and cyborg activity being used.
Looking for bots like these is a small part of the problem set.
Looking for bots like these is a small part of the problem set.

In this paper, I define manipulation as "an attempt by a small group of users to generate a large flow of traffic, disproportionate to the number of users involved."
The sort of thing often seen in bot strikes and attempts to game the Trending algorithm.
The sort of thing often seen in bot strikes and attempts to game the Trending algorithm.
Not all such attempts use bots, or need be considered nefarious. The point is to provide an early warning of possible manipulation attempts, so any nefarious ones can be isolated earlier.
The definition hinges on the idea of proportionate traffic. If you study enough control flows, you can see a range of activity which can be considered normal.
Flows which diverge massively from that range can then be studied in detail to see why.
Flows which diverge massively from that range can then be studied in detail to see why.
Example: after the Khashoggi murder, bots massively amplified pro-Saudi hashtags. In one of the flows, 96.3% of the traffic was retweets.
(h/t @marcowenjones for the lead on this)
(h/t @marcowenjones for the lead on this)
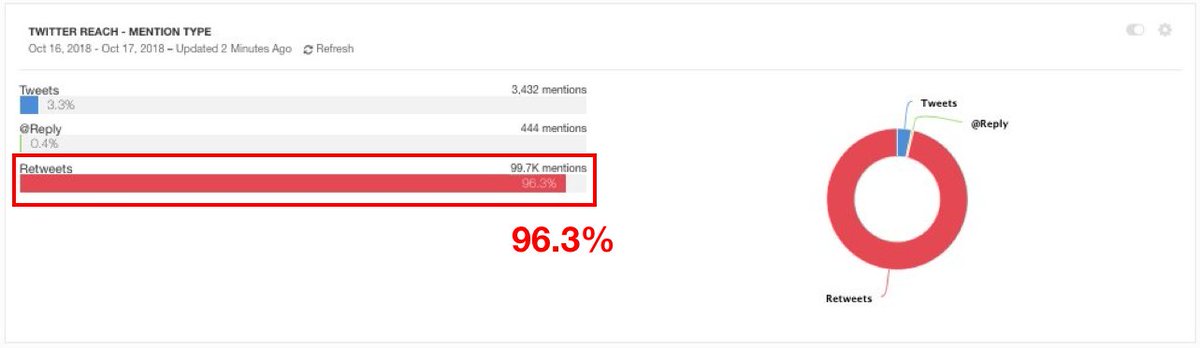
Compare that with the control flows, and none of them had a score much above 75% retweets.
A few points would be unexceptionable. A 20-point difference demands explanation.
A few points would be unexceptionable. A 20-point difference demands explanation.

Another example: this attempt to boost a pro-Marine Le Pen hashtag generated 24,001 tweets, but over 8,600 of them came from just 50 accounts.
That's over 35% of all the traffic.
That's over 35% of all the traffic.

Compare that with the control samples, and the proportion of traffic generated by the 50 most active posters was an order of magnitude less.

This call for a "Twitter storm" backing Doug Jones in Alabama ended up generating almost 43,000 tweets, but they came from under 9,000 users.
That's an average of almost 4.8 tweets per user. None of the control scans scored even half that.
That's an average of almost 4.8 tweets per user. None of the control scans scored even half that.

If you combine three indicators, you can generate a Coefficient of Traffic Manipulation (CTM):
Percentage of retweets (/10, to avoid overweighting);
Percentage of traffic from the 50 most active accounts;
Average number of posts per user.
Percentage of retweets (/10, to avoid overweighting);
Percentage of traffic from the 50 most active accounts;
Average number of posts per user.

Testing it on a range of traffic flows, including known manipulated samples, it separated them out pretty effectively.
Note that the CTM is comparative not absolute: it's not about a yes/no or bot/not finding, but flagging unusual flows for further study.
Note that the CTM is comparative not absolute: it's not about a yes/no or bot/not finding, but flagging unusual flows for further study.

Full paper here, with special thanks to the Oxford team @polbots.
comprop.oii.ox.ac.uk/wp-content/upl…
comprop.oii.ox.ac.uk/wp-content/upl…