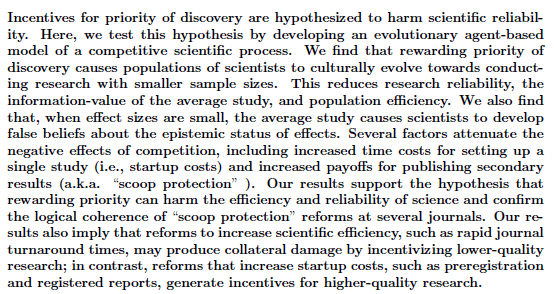
journals.plos.org/plosbiology/ar…
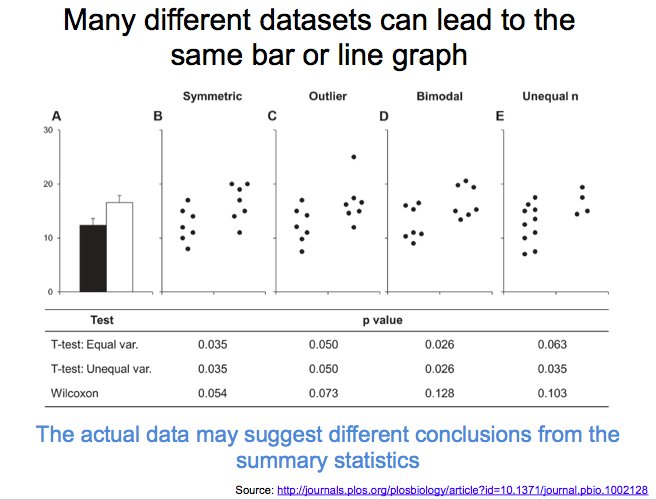
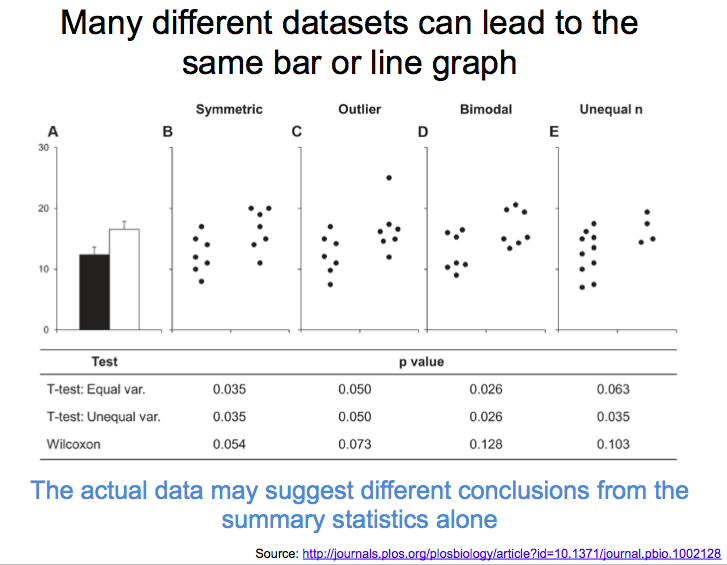
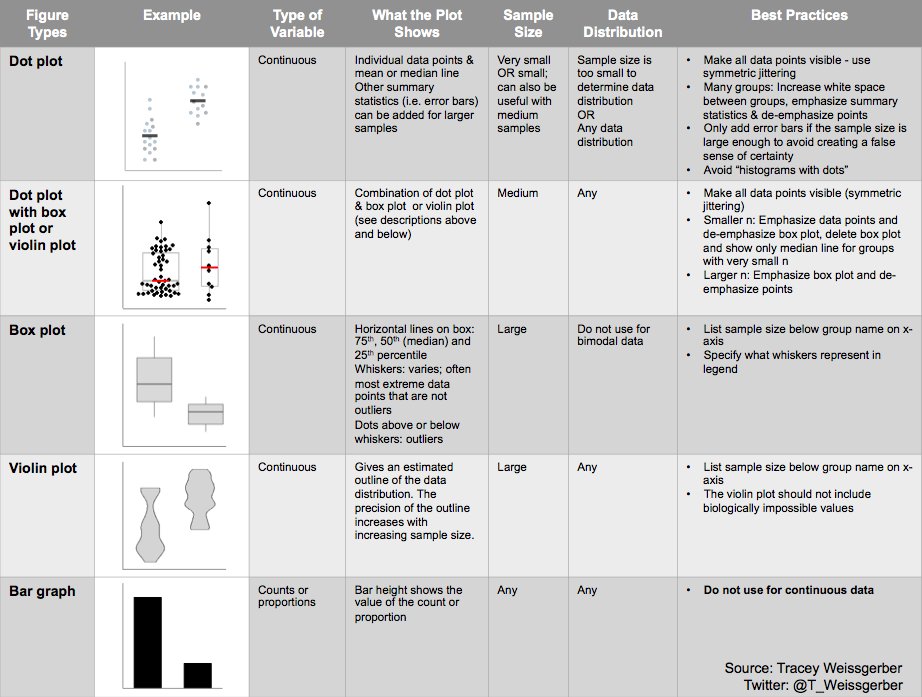
Box plots conceal the two peaks. Bimodal distributions are easier to see with dot plots (smaller samples) or violin plots (large samples)
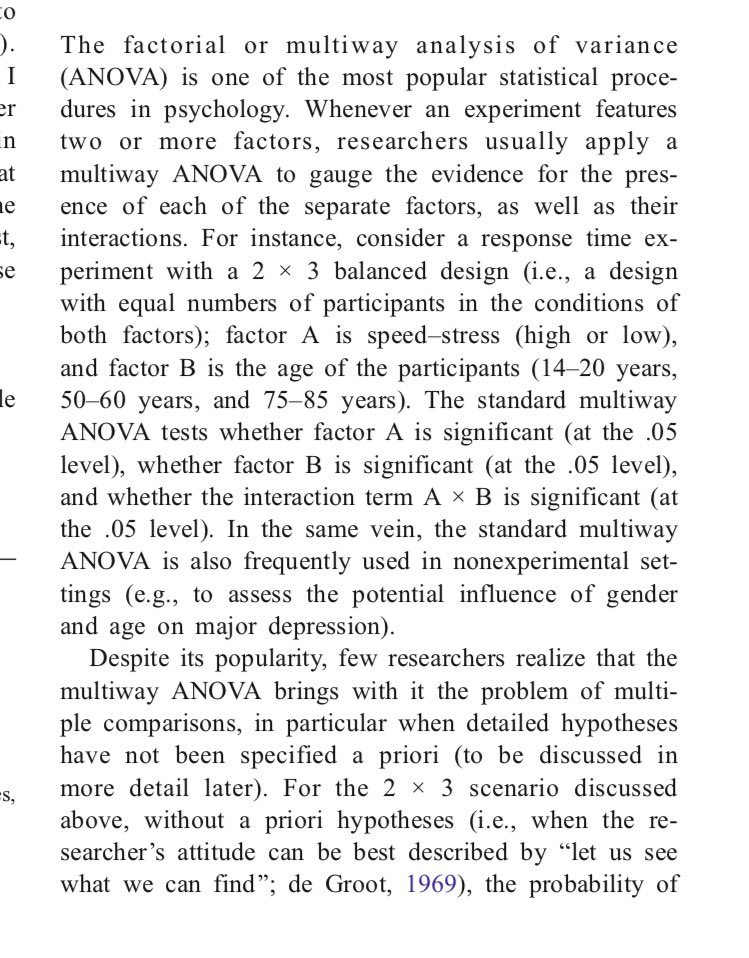
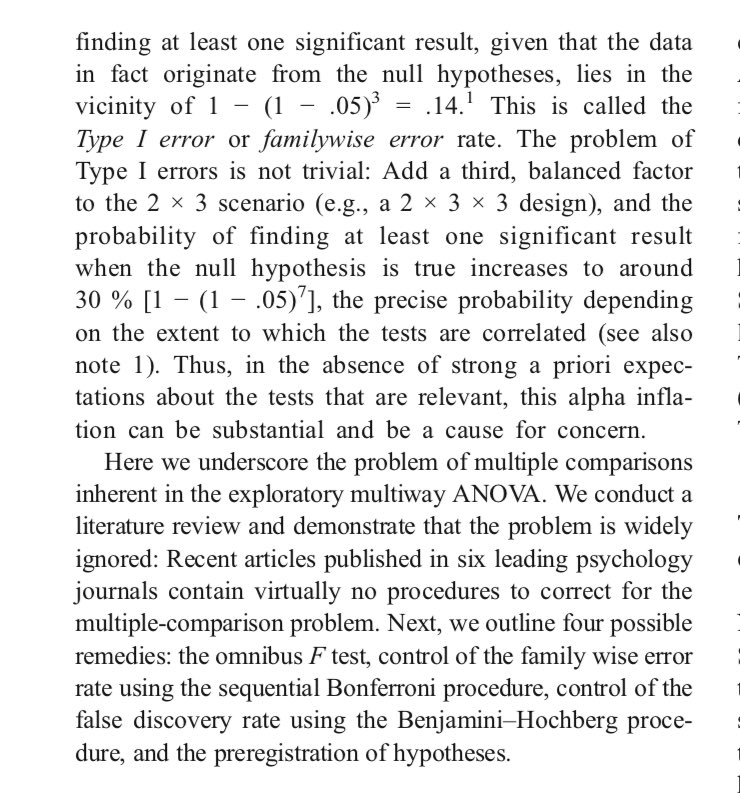
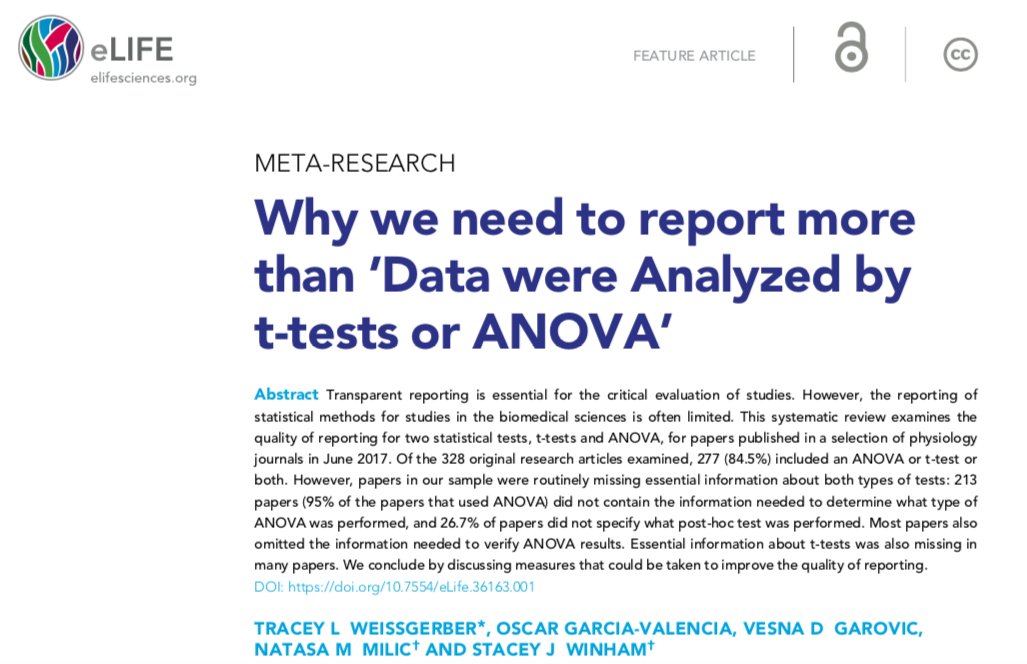
See our meta-research paper: Why we need to report more than “Data were analyzed by t-tests and ANOVA” on how to avoid problems caused by standard reporting practices. Clear reporting benefits everyone.
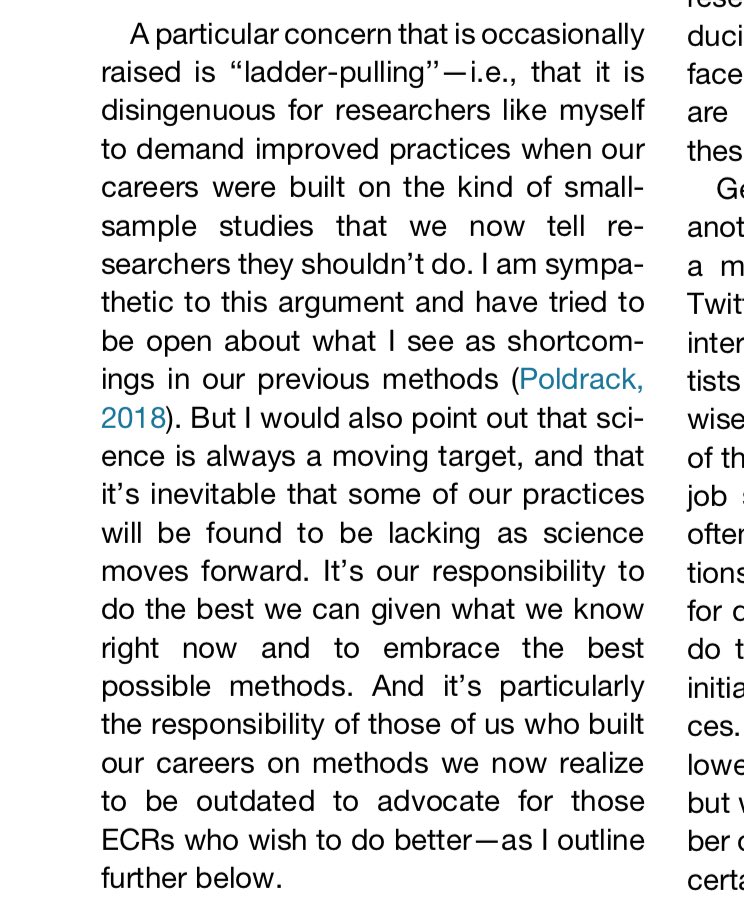
elifesciences.org/articles/36163
Provide citations to references and resources that will help your colleagues to understand the problem and make better graphics


