journals.plos.org/plosbiology/ar…
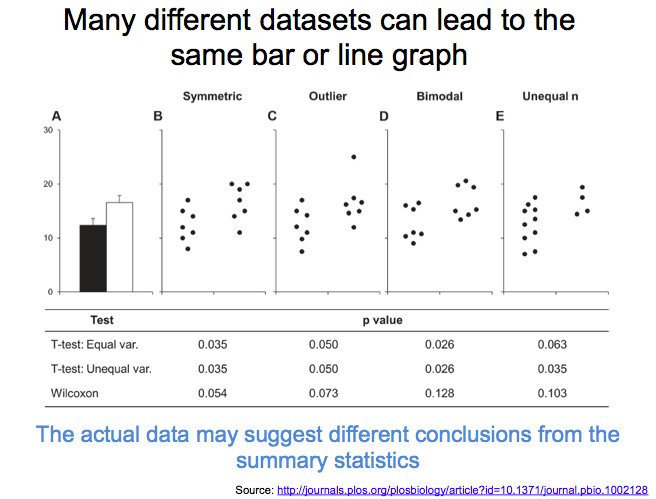
statistika.mfub.bg.ac.rs/interactive-do…
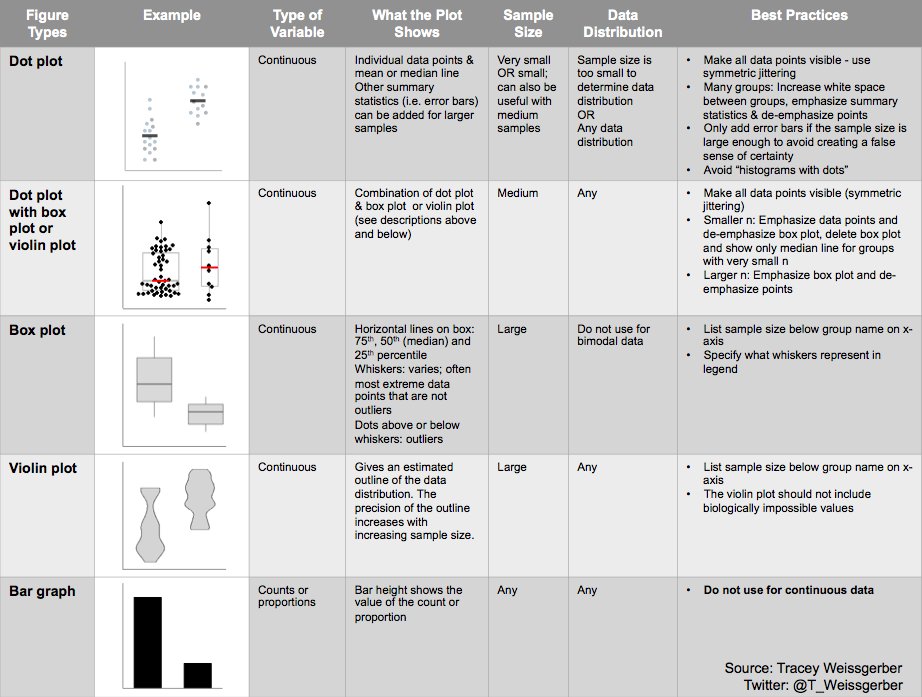
Box plots conceal the two peaks. Bimodal distributions are easier to see with dot plots (smaller samples) or violin plots (large samples)
Provide citations to references and resources that will help your colleagues to understand the problem and make better graphics
