,
9 tweets,
4 min read
Read on Twitter
Let's put together the meaning of softer US growth in Q4 2018 & abysmal trade/IP data in Asia in Q1 2019 & implications. We know:
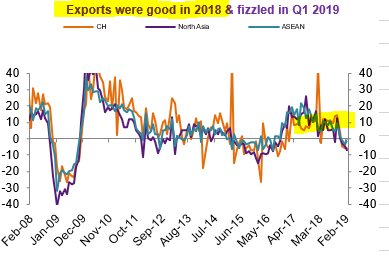
a) Asian trade were gang-buster up until Nov 2018 b/c of 👍🏻US demand & front-loading;
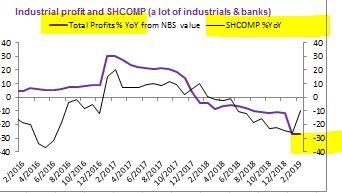
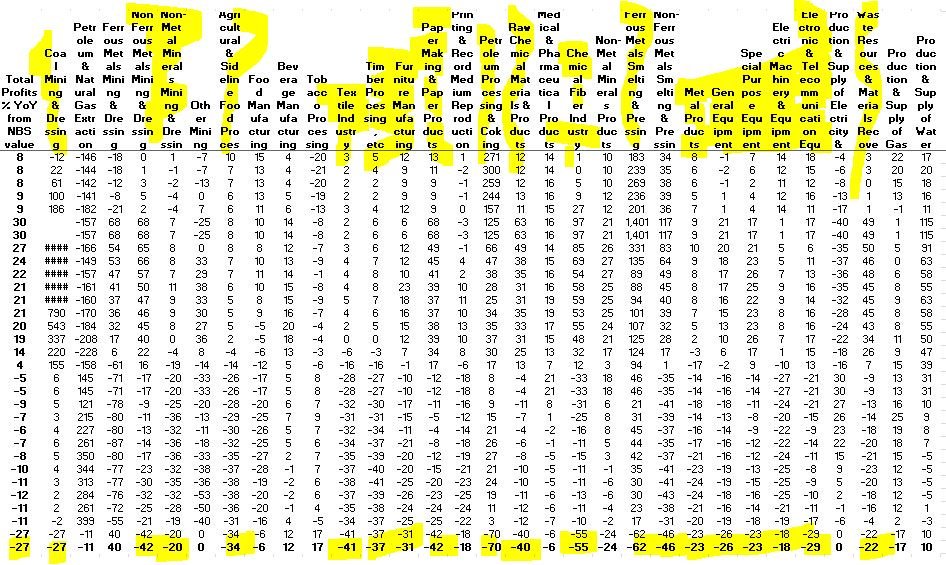
b) But Asian trade & IP started to lose steam rapidly in 2019
a) Asian trade were gang-buster up until Nov 2018 b/c of 👍🏻US demand & front-loading;
b) But Asian trade & IP started to lose steam rapidly in 2019
As the US is the largest economy in the world & also the largest customer for China (& key for other countries), what Asian exports, Americans import.
Okay, let's look at US imports in 2018 - amazing growth thanks to 📈demand + front-loading on expectations of higher tariffs 👇🏻
Okay, let's look at US imports in 2018 - amazing growth thanks to 📈demand + front-loading on expectations of higher tariffs 👇🏻
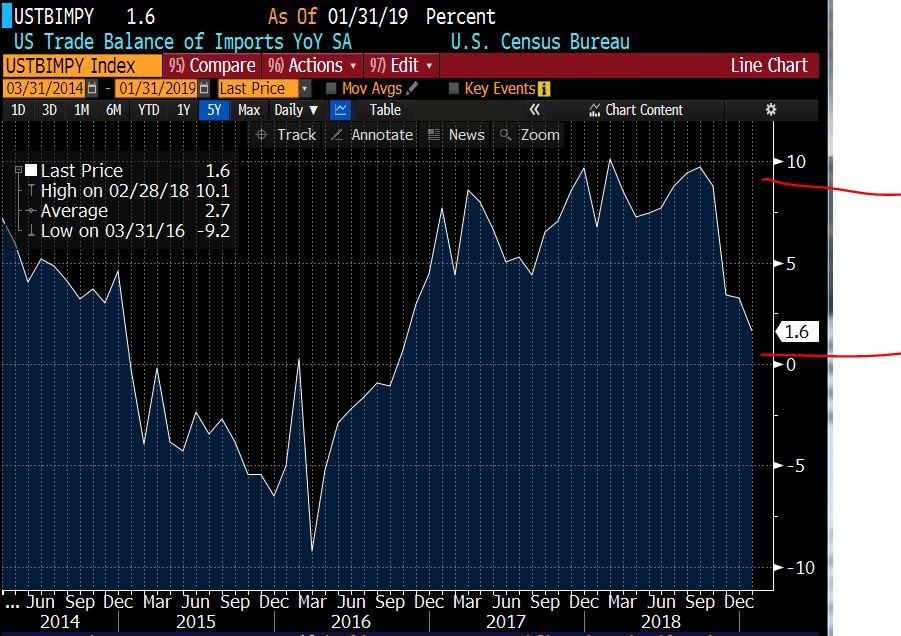
Don't have US Q1 GDP but know that US imports 📉& know that Asian exporters 📉, so:
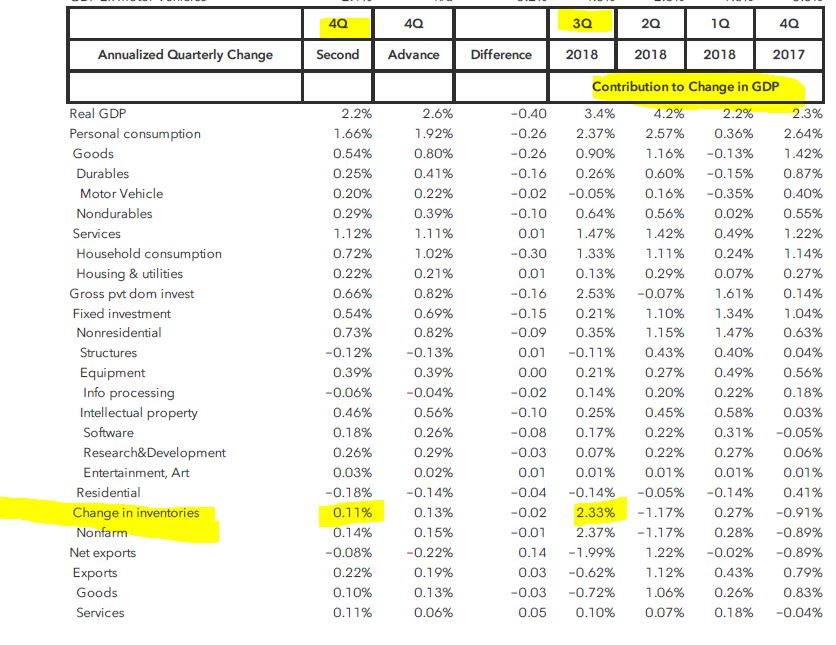
a) Demand for Asian goods from the US is down📉 due to large inventory build-up due to expectations so the front-loading impact is going in reverse;
b) US inventory draw-down needs to happen 1st
a) Demand for Asian goods from the US is down📉 due to large inventory build-up due to expectations so the front-loading impact is going in reverse;
b) US inventory draw-down needs to happen 1st
So US demand matters but we have a clue of US demand before US data is released from Asia. So wut does Asian data tell us about US demand in Jan+Feb '19:
a) China exports to the US -16% YoY; meaning US imports fell -16% from China;
b) Chinese import of American goods -34%YoY
😬
a) China exports to the US -16% YoY; meaning US imports fell -16% from China;
b) Chinese import of American goods -34%YoY
😬
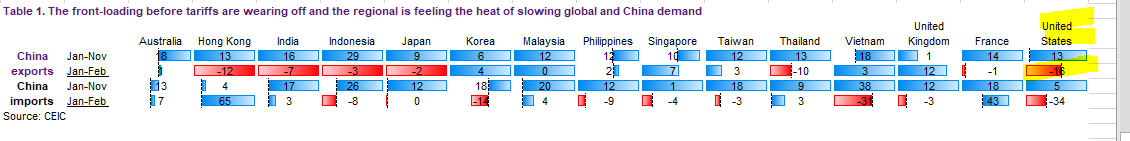
Asian trade data tells us not just Asian demand but also US demand in Q1 2019, which means that:
a) 2018 growth paid back in 2019 & it was superficially inflated by inventory build-up;
b) US growth impacted by inventory draw down & Asian IP weakened by excess supply & 📉demand.
a) 2018 growth paid back in 2019 & it was superficially inflated by inventory build-up;
b) US growth impacted by inventory draw down & Asian IP weakened by excess supply & 📉demand.
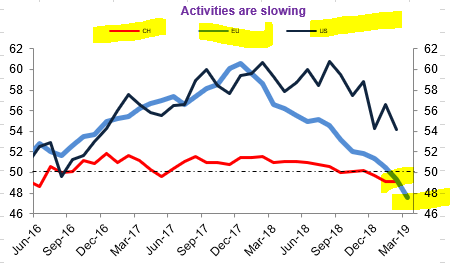
Here is a chart that tells u growth activities globally (manufacturing PMI):
a) EU activity is weakest - deep in contraction;
b) China also contracting but by less (March PMI next wk);
c) US growth best but not immune & so will come down w/ Asian + European weakness.
Q1 ugly 🥶
a) EU activity is weakest - deep in contraction;
b) China also contracting but by less (March PMI next wk);
c) US growth best but not immune & so will come down w/ Asian + European weakness.
Q1 ugly 🥶
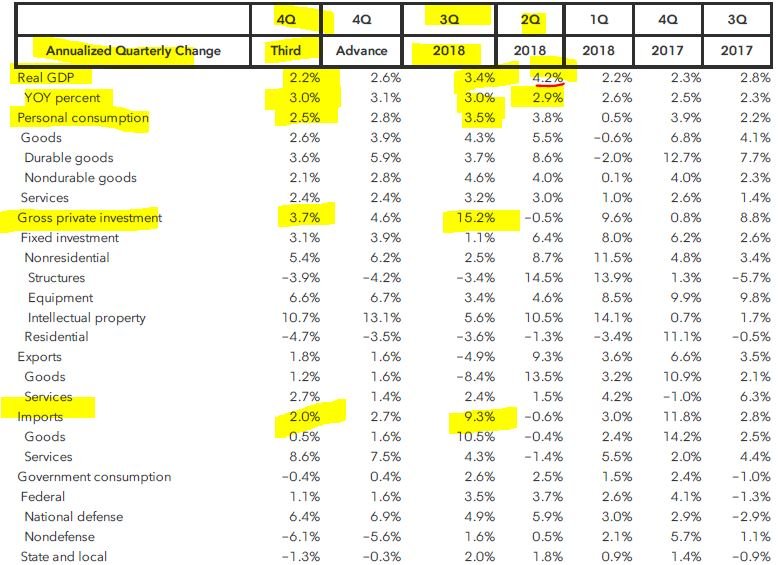
Here are some details of US real growth annualized QoQ:
a) Grew 2.2% QoQ SAAR & 3.0% YoY (Q4 2019 vs Q4 2018); GDP peaked in Q2 2018;
b) Consumption solid at 2.5% but slowing
c) Private investment slowed to 3.7% vs 15.2% in Q3;
d) Imports were massive in H218 so'll slow in H119
a) Grew 2.2% QoQ SAAR & 3.0% YoY (Q4 2019 vs Q4 2018); GDP peaked in Q2 2018;
b) Consumption solid at 2.5% but slowing
c) Private investment slowed to 3.7% vs 15.2% in Q3;
d) Imports were massive in H218 so'll slow in H119
Details of US corporate profits; it is +7.4%YoY (Q4 18 vs Q4 2017) but QoQ is -0.4% (Q4 vs Q3).
Details below👇🏻 of % QoQ & %YoY corporate profits.
Details below👇🏻 of % QoQ & %YoY corporate profits.


Btw, the macro data is confirmed by the micro:
Asian carriers have cargo traffic fall -12%YoY in February, following a Jan decline (Cathay already reported similar decline)
aircargoworld.com/allposts/cargo…
Asian carriers have cargo traffic fall -12%YoY in February, following a Jan decline (Cathay already reported similar decline)
aircargoworld.com/allposts/cargo…