,
105 tweets,
33 min read
Read on Twitter
This is the Housing Vancouver Strategy Annual Progress Report and Data Book 2019 summary thread! Big thanks to city staff for this, which is *chock full* of great data (so much so that summarizing is going to be difficult). vancouver.ca/files/cov/2019…
Note: All municipalities should be doing this. It's great for transparency and informed decision-making. If you don't live in the City of Vancouver (CoV), ask your municipality where their housing data book is at.
EXECUTIVE SUMMARY
Background: Housing Vancouver (2018-2027) is a 10-year housing strategy for the CoV to foster a diverse, vibrant community. /1
Background: Housing Vancouver (2018-2027) is a 10-year housing strategy for the CoV to foster a diverse, vibrant community. /1
The strategy is based on 3 core principles:
1. Create the "Right Supply" and address speculative demand;
2. Protect existing affordable housing for the future; and
3. Ensure support for vulnerable residents
Housing Vancouver commits to annual progress reporting (yay!) /2
1. Create the "Right Supply" and address speculative demand;
2. Protect existing affordable housing for the future; and
3. Ensure support for vulnerable residents
Housing Vancouver commits to annual progress reporting (yay!) /2
Housing Affordability Metrics in 2018
Growth and Housing Market Demand: Strong fundamentals driving an active market, but some signs of future moderation
-CoV property market is active, with 7000 sales in 2018, slightly down from over 10,000 sales in 2017
/3
Growth and Housing Market Demand: Strong fundamentals driving an active market, but some signs of future moderation
-CoV property market is active, with 7000 sales in 2018, slightly down from over 10,000 sales in 2017
/3
-Rental vacancy rates in purpose-built rental housing remain extremely low (0.8% in 2018 city-wide, slightly lower than 0.9% in 2017. /4
-Local demand continunes to underpin real estate activity in Van, driven by strong economic fundamentals in the city and region (GDP, jobs, population growth, rising average incomes). However, mortgage rates rose in 2018 to 4.39% from a 10-year low of 3.7% in 2017 /5
-Benchmark detached home prices fell by 5% in Van East and 10% in Van West from Oct 2017 to Oct 2018. Prices remain largely out of reach for local incomes given that prices have increased by 141% in last 10 years in Van East while median household incomes grew <40%. /6
Benchmark condo prices fell 5.7% in Van East and 0% in Van West from Oct 2017 to Oct 2018. /7
Housing Stock Growth: Increase in housing stock serving a broad continuum of incomes
-Housing supply continues to grow in CoV, driven by above average starts and completions across all housing types (over 6,500 starts and nearly 8,000 completions in 2018) /8
-Housing supply continues to grow in CoV, driven by above average starts and completions across all housing types (over 6,500 starts and nearly 8,000 completions in 2018) /8
Over the past 10 years, the average annual number of starts has been 5,221 unites and average number of completions has been 4,891 units. In 2018, 34% of housing starts and 30% of completions were purpose-built (market and non-market) rental apartments. /9
There is evidence that existing rental stock may not meet the needs of all Van households, including families - in 2016 there were over 29,000 renter families with children in city, but only 18,500 2/3 bedroom purpose-built rental units in 2018. /10
There's also continued need for new housing affordable to the diversity of incomes in Vancouver. /11
Housing Affordability: Affordability continues to be a challenge for Van households, and may be driving loss of income diversity
-Housing costs continue to rise across housing types: average private market rents increased by 6.4% between 2017 & 2018; Van East condos by 5.7% /12
-Housing costs continue to rise across housing types: average private market rents increased by 6.4% between 2017 & 2018; Van East condos by 5.7% /12
Those condo prices rose by 19.5% (!!!) between 2016 and 2017.
-Units vacant and available on the market are more expensive than occupied units: in 2018, avg rent in private purpose-built rental (PBR) was approx 20% higher in vacant units than occupied units in Van. /13
-Units vacant and available on the market are more expensive than occupied units: in 2018, avg rent in private purpose-built rental (PBR) was approx 20% higher in vacant units than occupied units in Van. /13
-Affordability is contributing to severe housing challenges for vulnerable residents. Total # of sheltered and unsheltered homeless residents increased from 2,138 in 2017 to 2,181 in 2018. 40% of homeless population reporting an Indigenous identity in 2018. /14
Note: This bears repeating - 40%!!! of homeless people report an Indigenous identity. As @Khelsilem has said, it's quite horrible that so many Indigenous folks are homeless on their own ancestral lands. This report is also very much worth a read: vancouver.ca/files/cov/vanc… /15
-There is evidence that change in the income distribution in Vancouver that may support loss of renter households at the lower end of the income spectrum - the share of renter households earning below $30,000/year fell from 44% in 2005 to 32% in 2015, while /16
the share of renter households earning over $80,000/year increased from 13% to 28% in same period.
These trends indicate potential risk to long-term diversity and resilience of our city, reinforcing the need for "Right Supply" of housing that meets the needs of all incomes /17
These trends indicate potential risk to long-term diversity and resilience of our city, reinforcing the need for "Right Supply" of housing that meets the needs of all incomes /17
Healthy Housing System Indicators
They're tracking high-level housing system indicators over the course of the strategy. Summary:
1. Prevent homelessness and create pathways to housing stability (track # of homeless) /18
They're tracking high-level housing system indicators over the course of the strategy. Summary:
1. Prevent homelessness and create pathways to housing stability (track # of homeless) /18
2. Increase and improce housing for very low-income residents (# of non-market shelter rate singles units, # of SRA permits & grants)
3. Enhance Indigenous housing and wellness (# of Indigenous-owned social housing units, # of Indigenous households in core housing need) /19
3. Enhance Indigenous housing and wellness (# of Indigenous-owned social housing units, # of Indigenous households in core housing need) /19
4. Increase vacancy rates for rental housing (vacancy rates in CoV and Metro Van, vacancy rates of rental apartment stock by rent ranges)
5. Increase share of rental homes affordable to low- and moderate- incomes
(renter income distribution over time, distribution of rents) /20
5. Increase share of rental homes affordable to low- and moderate- incomes
(renter income distribution over time, distribution of rents) /20
6. Increase stock of family-sized housing (family households with children as a share of total households in the city & region, # of family-sized PBR apartment units, # of under-housed family households) /21
7. Bring ownership costs in line with family incomes (change in ownership costs for condos vs. change in couple family median household income)
8. Increase housing options in low-density neighbourhoods (density of dwelling units and net change in dwelling units by local area) /22
8. Increase housing options in low-density neighbourhoods (density of dwelling units and net change in dwelling units by local area) /22
Note: all in all, this list I think is a very solid list of numbers for all municipalities' city staff to be tracking, if they aren't already. If not, then I think it's a good indication that they're not really taking the housing crisis as seriously as they should. /23
Note continued: Indeed, I might contact the other municipalities around here and ask them if they have this data on hand... @jonathanxcote @BradWestPoCo @LindaCBuchanan @Mike4DNVMayor @maryannbooth @Hurley4Burnaby @MayorStewart @malcolmbrodie @SurreyMayor
Back to the Data Book!
Progress Toward Housing Vancouver 10-year Targets
Each year, staff will report on whether CoV is meeting the new targets, prioritizing:
1. Shifting housing approvals toward rental housing for diverse incomes
/25
Progress Toward Housing Vancouver 10-year Targets
Each year, staff will report on whether CoV is meeting the new targets, prioritizing:
1. Shifting housing approvals toward rental housing for diverse incomes
/25
2. Meeting ambitious targets for housing for low-income households, in partnership with senior levels of gov't and housing providers
3. Delivering a diversity of housing for families, including apartments and ground-oriented housing forms /26
3. Delivering a diversity of housing for families, including apartments and ground-oriented housing forms /26
The 2018 data in this report is the first full-year reporting cycle.
Overall, a total of 15.406 housing units have been approved toward the Housing Vancouver targets as of Dec. 31, 2018. /27
Overall, a total of 15.406 housing units have been approved toward the Housing Vancouver targets as of Dec. 31, 2018. /27
Key highlights:
-shift in new housing approvals toward "Right Supply" in tenure, w/ 61% of total units available for renters
-over 5,300 new homes serving incomes under $80,000 per year, making up 35% of all approvals; however, /28
-shift in new housing approvals toward "Right Supply" in tenure, w/ 61% of total units available for renters
-over 5,300 new homes serving incomes under $80,000 per year, making up 35% of all approvals; however, /28
not meeting targets for rental homes affordable to residents earning $30k~$50k per year.
-not meeting overall purpose-built rental housing targets, with only 1,031 homes approved in 2018 (52% of target) /29
-not meeting overall purpose-built rental housing targets, with only 1,031 homes approved in 2018 (52% of target) /29
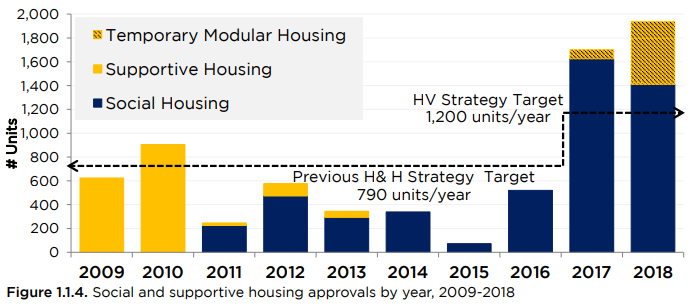
-highest level of social & supportive housing approcals since 2009, with 1,938 units approved, exceeding last year's figure of 1,702
-528 temporary modular homes approved, rented at shelter rate ($375/month)
-highest level of laneway housing permits since 2009, 709 approved /30
-528 temporary modular homes approved, rented at shelter rate ($375/month)
-highest level of laneway housing permits since 2009, 709 approved /30
-not meeting ground-oriented housing targets, with only 86 townhouse units (17% of annual target) approved in 2018
-exceeding target for family-sized (2/3 bedroom) units, with 7,813 units approved /31
-exceeding target for family-sized (2/3 bedroom) units, with 7,813 units approved /31
In addition to approvals, record number of housing completions in 2018, including:
-highest # of social & supportive housing completions in a decade, with 931 units opened
-highest year of market PBR completions since 1970, with 1,427 units opened /32
-highest # of social & supportive housing completions in a decade, with 931 units opened
-highest year of market PBR completions since 1970, with 1,427 units opened /32

Housing Vancouver Action Plan Update
The plan has 110 priority actions for the first 3 years. Key action highlights:
-$38 million in revenue from 1st year of Empty Homes Tax
-Council approved Broadway Interim Rezoning Policy to curb land speculation /33
The plan has 110 priority actions for the first 3 years. Key action highlights:
-$38 million in revenue from 1st year of Empty Homes Tax
-Council approved Broadway Interim Rezoning Policy to curb land speculation /33
-Affordable Housing Delivery & Financial Strategy is creating the new Vancouver Affordable Housing Endowment Fund (VAHEF)
-404 temporary modular homes (TMH) tenanted in 2018, further 202 homes in development
/34
-404 temporary modular homes (TMH) tenanted in 2018, further 202 homes in development
/34
-20 proposals invited to proceed under Moderate Income Rental Housing Pilot Program, targeting rental units for singles making $30-50k/year and families earning $50-80k/year
Note: I wrote about MIRHPP for the @georgiastraight here, great program: straight.com/news/1236246/j…
/35
Note: I wrote about MIRHPP for the @georgiastraight here, great program: straight.com/news/1236246/j…
/35
-over 900 affordable housing units permitted in half the average development time under the SHORT pilot program to expedite delivery of affordable housing with over 2,000 units in pipeline
-updates made to the Rental Housing Stock Official Development Plan to reduce threshold /36
-updates made to the Rental Housing Stock Official Development Plan to reduce threshold /36
-development of a CoV Renters Office to better support renters in pursuing their tenancy rights and a new Renter Advocacy and Support Services officer hired
-partnered with non-profit operator to open 100 additional warming center over-night spaces at Powell Street Getaway /37
-partnered with non-profit operator to open 100 additional warming center over-night spaces at Powell Street Getaway /37
Note: And that's the executive summary! Moving forward, I'm going to focus on key graphs and important info not already mentioned in the exec summary. /38
Section 1: Housing Vancouver Targets
2-year summary /39
2-year summary /39

Overall Progress in 2018 toward 10-year targets
(below-targets for PBR and townhouses) /40
(below-targets for PBR and townhouses) /40

1.1a Social, Supportive, and Co-operative Housing (pg 21)
Previous Housing and Homelessness Strategy (2012-2021) set ambitious targets for housing growth, and city had reached 46% of social housing targets at the midway point in 2016. However... /41
Previous Housing and Homelessness Strategy (2012-2021) set ambitious targets for housing growth, and city had reached 46% of social housing targets at the midway point in 2016. However... /41
the escalating housing crisis required the City to review and re-set its targets and approach to delivery. The Housing Vancouver Strategy set a new, higher target for social housing: 12,000 housing units to meet the needs of lower income residents, exceeding previous targets /42
by 50 percent. In 2018, CoV approved 1,938 social homes, highest since 2009 and surpassing the annualized target by 62%. 31% of approved units in 2018 were family-sized. /43

Affordability
Housing Vancouver targets aim to ensure that new homes appropriate match the diversity of household incomes in CoV.
Shelter rates: rents for $375, the shelter component of income assistance for incomes under $15k for singles and below $30k for families /44
Housing Vancouver targets aim to ensure that new homes appropriate match the diversity of household incomes in CoV.
Shelter rates: rents for $375, the shelter component of income assistance for incomes under $15k for singles and below $30k for families /44
Housing Income Limit (HILs) rates: set by BC Housing (province). Affordable to incomes of $15k~48k for singles and $30k~68k for families.
Low-end of market rates: rents set to be affordable to incomes of $48k~71k for singles and $68~104k for families. Also set by BC Housing /45
Low-end of market rates: rents set to be affordable to incomes of $48k~71k for singles and $68~104k for families. Also set by BC Housing /45
(minimum) Affordability breakdown of projects approved in 2018 - these can become more affordable with further public subsidy. /46

Homeless Count
Indigenous people vastly overrepresented in homeless population. 40% of homeless, while people of Indigenous identity make up 2.2% of city's general population. /47
Indigenous people vastly overrepresented in homeless population. 40% of homeless, while people of Indigenous identity make up 2.2% of city's general population. /47

Advancing our Commitment as a City of Reconciliation
Supporting the delivery of a minimum of 600-700 Indigenous society owned/operated affordable homes by 2022 /48
Supporting the delivery of a minimum of 600-700 Indigenous society owned/operated affordable homes by 2022 /48

More TMH, SROs, and new units at the shelter rate ($375) /49

The City approved 1.938 units of social and supportive housing in 2018, including 1,358 units delivered through use of City-owned land, non-profit and gov't partnerships, inclusionary housing policies, and community plans. /50


New Housing Vancouver targets set a high bar for shifting new supply toward rental housing. The city is falling short of the new targets in 2017/2018. /51


Affordability targets for new housing is based on income bands and 30% of income. /52

PBR delivery mechanisms:
12 units under existing zoning
460 units under Rental 100
132 units under Interim Rezoning Policy for Affordable Housing Choices
427 units under recent community plans in Grandview-Woodland, Marpole, Cambie Corridor, DTES, West End. /53
12 units under existing zoning
460 units under Rental 100
132 units under Interim Rezoning Policy for Affordable Housing Choices
427 units under recent community plans in Grandview-Woodland, Marpole, Cambie Corridor, DTES, West End. /53


Condos and Townhouses
Housing Vancouver target: 30k new condo apartments and 5k new townhouses over 10 years. 30% of these will likely become rental stock. In 2018, 50% of condos were family-sized. /54
Housing Vancouver target: 30k new condo apartments and 5k new townhouses over 10 years. 30% of these will likely become rental stock. In 2018, 50% of condos were family-sized. /54

Infill Housing (Laneways and Coach Houses)
Meeting Housing Vancouver targets! They're concentrated in the East Side.
/55
Meeting Housing Vancouver targets! They're concentrated in the East Side.
/55


Note: This concludes section 1. Break time!
Section 2: Housing Stock Indicators
This chapter breaks down the CoV housing stock, covering non-market, rental, and ownership housing as well as development processing times. /57
This chapter breaks down the CoV housing stock, covering non-market, rental, and ownership housing as well as development processing times. /57
Non-market (Social and Supportive) Housing Stock
Inventory is tracked and monitored by the city, and can be found here: app.vancouver.ca/NonMarketHousi…
/58
Inventory is tracked and monitored by the city, and can be found here: app.vancouver.ca/NonMarketHousi…
/58
Social Housing is defined by the CoV Zoning and Development By-Law as rental housing in which at least 30% of units are occupied by households with incomes below housing income limits (HILs), which is published by BC Housing. /59
Non-market co-ops are social housing that is owned and managed by co-operative associations of the residents.
Supportive housing is social housing with flexible supports that help individuals maintain housing stability, provided by on-site staff or outreach programs. /60
Supportive housing is social housing with flexible supports that help individuals maintain housing stability, provided by on-site staff or outreach programs. /60
Key observations:
-lots of units on City land, many for seniors, concentrated in the Downtown Eastside. Fewest in Shaughnessy, Kerrisdale, Dunbar-Southlands. /61
-lots of units on City land, many for seniors, concentrated in the Downtown Eastside. Fewest in Shaughnessy, Kerrisdale, Dunbar-Southlands. /61


Indigenous Society Owned/Operated Non-Market Housing Stock
Indigenous non-profit groups operate these, geared for at risk populations.
Lu'Ma Housing and Vancouver Native Housing Society are the two Indigenous housing providers in CoV. /62
Indigenous non-profit groups operate these, geared for at risk populations.
Lu'Ma Housing and Vancouver Native Housing Society are the two Indigenous housing providers in CoV. /62
Grandview-Woodland holds 44% of these Indigenous non-market housing stock of Van. It's also the local area with the highest share of Indigenous residents in Van. Approximately 5% of the total non-market housing stock in Van is Indigenous owned/operated. /63

CoV aims for 50% of social housing = family-size. 32% of non-market (NM) housing is family-sized. 14% of NM housing in the DTES is family-sized, because many of those units in DTES were created by conversion of private single room occupancy (SRO) units to NM housing. /64

Non-market Housing Completions
-in 2018, total of 931 social and supportive housing units opened. 527 were permanent, 404 were temporary modular homes.
-2018 had highest volume completions since the late 1980s. Done in partnership with BC Housing. /65
-in 2018, total of 931 social and supportive housing units opened. 527 were permanent, 404 were temporary modular homes.
-2018 had highest volume completions since the late 1980s. Done in partnership with BC Housing. /65


Change in Non-Market (NM) Housing Stock
-a significant amount of NM housing that exists today made possible by fed and prov funding programs
-from 1960-1989, 15,796 units were created in CoV
-gradual declime in NM housing production because of end of fed gov't funding in 90s /66
-a significant amount of NM housing that exists today made possible by fed and prov funding programs
-from 1960-1989, 15,796 units were created in CoV
-gradual declime in NM housing production because of end of fed gov't funding in 90s /66
-in 2017, feds and prov signaled renewed involvement in funding new NM housing projects through National Housing Strategy and Provincial 30-Point Plan
-from 1990-2018, CoV created 10,100 NM housing units, making up approx 64% of NM created in previous 3 decades /67
-from 1990-2018, CoV created 10,100 NM housing units, making up approx 64% of NM created in previous 3 decades /67
Note: The CoV really did quite a bit to try and make up for the drop in funding from the province and feds. I haven't compared the numbers, but I bet it's done a lot more than most, if not all, other municipalities in making up for this shortfall for NM housing. /68
-as of Dec 2018, overall production of NM housing is back to levels previously achieved in the 1970s /69

SRO Stock for Low-Income Singles
-388 private SRO units closed between 2015-2017
-287 NM units opened between 2015-2017
-closure of Balmoral Hotel and Jubilee Rooms removed 245 tenanted units from SRO stock in DTES /70
-388 private SRO units closed between 2015-2017
-287 NM units opened between 2015-2017
-closure of Balmoral Hotel and Jubilee Rooms removed 245 tenanted units from SRO stock in DTES /70
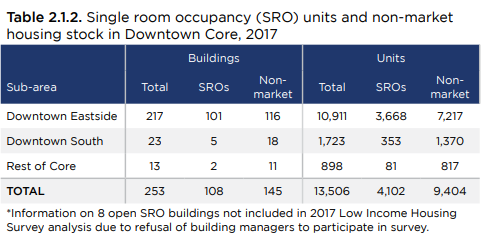

-overall vacancy rate of SROs estimated to be at 1% as of Dec 2017
-private SRO stock decreased by almost half, from 7,830 units in 1994 to 4,102 in 2017, most converted to NM housing
-net positive gain of approx 702 units, 6% increase from 1994-2017 /71
-private SRO stock decreased by almost half, from 7,830 units in 1994 to 4,102 in 2017, most converted to NM housing
-net positive gain of approx 702 units, 6% increase from 1994-2017 /71


Market Rental Housing
-non-subsidized properties rented to a tenant
-comprised of both primary (purpose-built) and secondary rental units (e.g. secondary suites, rented condos, rented houses etc.) /72
-non-subsidized properties rented to a tenant
-comprised of both primary (purpose-built) and secondary rental units (e.g. secondary suites, rented condos, rented houses etc.) /72
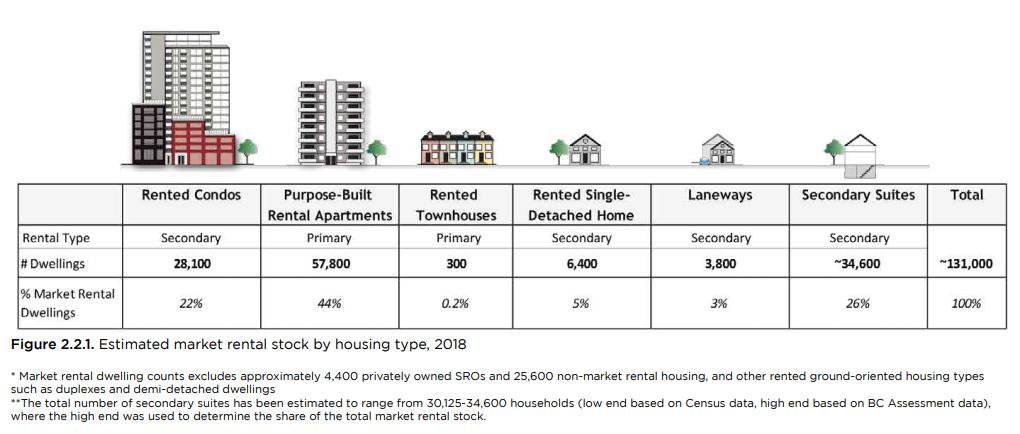
-overall, ~131,000 rental units in CoV, 66% in form of apartments, rest are ground-oriented
-primary rental makes up just under half (45%), at 58,100 units
-of total rental stock, 33% consists of rented condos
-secondary suites make up 47% of total secondary rental stock /73
-primary rental makes up just under half (45%), at 58,100 units
-of total rental stock, 33% consists of rented condos
-secondary suites make up 47% of total secondary rental stock /73
-PBR makes up approx 25% of all occupied dwellings in Vancouver
-CoV accounted for 53% of all PBR in Metro Van in 2018
-West End is 66% PBR
-78% of all rental housing units are located within Rental Housing Stock ODP covered zones /74
-CoV accounted for 53% of all PBR in Metro Van in 2018
-West End is 66% PBR
-78% of all rental housing units are located within Rental Housing Stock ODP covered zones /74


-most PBR was built in 1950-1969, incentivized by federal taxation measures and provisions designed to stimulate investment in residential rental development
-rental housing built between 1950-1979 accounts for over half (63%) of existing PBR supply (e.g. in West End) /75
-rental housing built between 1950-1979 accounts for over half (63%) of existing PBR supply (e.g. in West End) /75

-end of senior gov't rental supply programs in 1990-2009 meant decline in development of PBR
-since 2009, PBR production has increased, due to city programs such as Short Term Rental Incentive Program (STIR) and Rental 100, as well as Community plans /76
-since 2009, PBR production has increased, due to city programs such as Short Term Rental Incentive Program (STIR) and Rental 100, as well as Community plans /76

Family PBR Housing Stock
-since 1990s, CoV required minimum of 25% family-sized units
-CoV Family Room Housing Mix Rezoning Policy requires minimum 35% family units
-approx 18% of total PBR stock is family-sized
-projects from 2017/2018 are approx 40% family-sized /77
-since 1990s, CoV required minimum of 25% family-sized units
-CoV Family Room Housing Mix Rezoning Policy requires minimum 35% family units
-approx 18% of total PBR stock is family-sized
-projects from 2017/2018 are approx 40% family-sized /77

Secondary Suites
-basement/ground-level rental, often used to help pay for a mortgage
-there is limited data on these because of unpermitted suites. These are estimated numbers. /78
-basement/ground-level rental, often used to help pay for a mortgage
-there is limited data on these because of unpermitted suites. These are estimated numbers. /78

Secondary Condo Rental Stock
-for past 5 years, approx a third of condos have been rented on the secondary rental market
-overall stock of condos have grown consistently since 2014 /79
-for past 5 years, approx a third of condos have been rented on the secondary rental market
-overall stock of condos have grown consistently since 2014 /79


Vacancy Rates for Market PBR
-the PBR vacancy rate is a primary measure of how supply is responding to demand in the housing market. A residential vacancy rate of 3-5% is generally considered a balanced market
-Vancouver has historically low vacancy rates in the last 30 years /80
-the PBR vacancy rate is a primary measure of how supply is responding to demand in the housing market. A residential vacancy rate of 3-5% is generally considered a balanced market
-Vancouver has historically low vacancy rates in the last 30 years /80

-In 2018, the PBR vacancy rate was 0.8% in Vancouver, 1.0% in Metro Vancouver
-rented condo vacancy rate was 0.3% in CoV
-Downtown had highest vacancy rate at 1.2%, Southeast Van lowest, at 0.2% /81
-rented condo vacancy rate was 0.3% in CoV
-Downtown had highest vacancy rate at 1.2%, Southeast Van lowest, at 0.2% /81


Vacancy Rates for Secondary Rental Condos
-again, 3-5% is considered a balanced market
-over the past 5 years, the vacancy rate has consistently been low, below 1%
-highest vacancy rate was in 2015, at 0.8% /82
-again, 3-5% is considered a balanced market
-over the past 5 years, the vacancy rate has consistently been low, below 1%
-highest vacancy rate was in 2015, at 0.8% /82

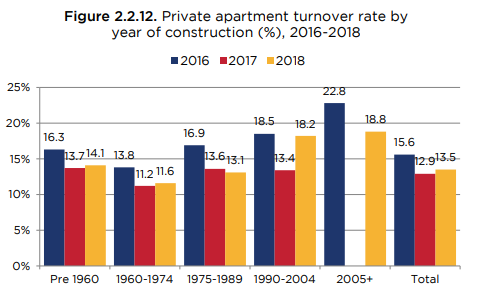
Apartment Turnover Rate
-in 2018, apartments built in 1990~present had higher turnover rates than apartments built prior to 1990
-3 bedroom units turn over less often than other unit types /83
-in 2018, apartments built in 1990~present had higher turnover rates than apartments built prior to 1990
-3 bedroom units turn over less often than other unit types /83

Rental Housing Starts
-housing starts in Van have been near or above the 10-year average since 2012
-in recent years, Van has seen an increasing proportion of rental apartment starts
-in last 10 years, 53% of rental starts in Metro Van have been located in CoV /84
-housing starts in Van have been near or above the 10-year average since 2012
-in recent years, Van has seen an increasing proportion of rental apartment starts
-in last 10 years, 53% of rental starts in Metro Van have been located in CoV /84


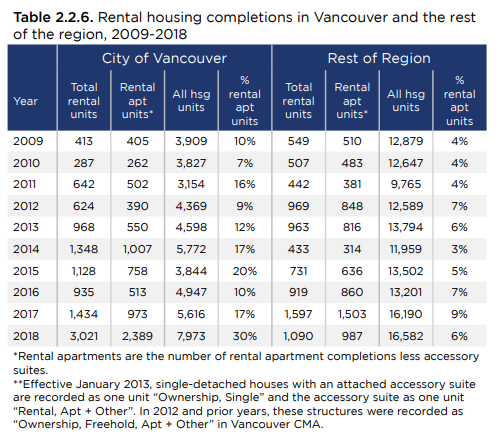
Rental Housing Completions
-in last 10 years, 51% of rental apartment housing completions in region were in the CoV
-rental completions in 2018 were especially strong, with 2,400 of the total 8,000 units completed being rental apartments /85
-in last 10 years, 51% of rental apartment housing completions in region were in the CoV
-rental completions in 2018 were especially strong, with 2,400 of the total 8,000 units completed being rental apartments /85


Change in PBR Stock
-Vancouver leads the region in terms of net gain in PBR units, supported by the effectiveness of the Rental Housing Stock ODP in protecting against major rental losses and city's various rental incentive programs to encourage new construction /86
-Vancouver leads the region in terms of net gain in PBR units, supported by the effectiveness of the Rental Housing Stock ODP in protecting against major rental losses and city's various rental incentive programs to encourage new construction /86


Ownership Housing in CoV
-approx 44% of ownership households resided in apartment buildings
-RS zoning districts constitute approx. 57% of CoV's developable landmass and include 26% of all owner-occupied dwellings in Van
-Townhouses make up 4% /87
-approx 44% of ownership households resided in apartment buildings
-RS zoning districts constitute approx. 57% of CoV's developable landmass and include 26% of all owner-occupied dwellings in Van
-Townhouses make up 4% /87

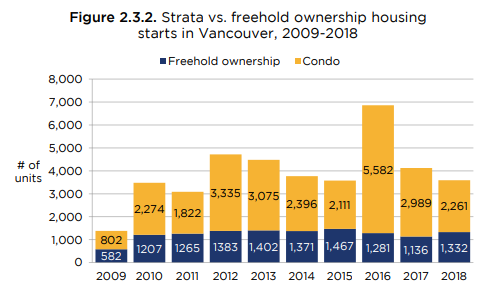
Ownership Housing Starts
-peaked in Van in 2016 with 6,863 units
-over past 10 years, condos are majority of ownership housing starts in Van and region /88
-peaked in Van in 2016 with 6,863 units
-over past 10 years, condos are majority of ownership housing starts in Van and region /88

Ownership Housing Completions
-in last 10 years, majority of housing completions in Van have been ownership units, however in 2018 that share was lowest in 10 years at 61%, while rental was highest in 10 years at 30% /89
-in last 10 years, majority of housing completions in Van have been ownership units, however in 2018 that share was lowest in 10 years at 61%, while rental was highest in 10 years at 30% /89


Change in Dwelling Units in Low-Density Areas
-Housing Vancouver includes a priority action to expand housing options in low-density areas (RS and RT zones)
-since 2016, the annual increase in number of dwelling units in low-density areas has been less than 1% of overall /90
-Housing Vancouver includes a priority action to expand housing options in low-density areas (RS and RT zones)
-since 2016, the annual increase in number of dwelling units in low-density areas has been less than 1% of overall /90
-between 2016~2018, there has been an increase of 1,300 dwelling units in low-density areas, mostly due to laneway house and secondary suite additions /91

Development and Building Permit Volumes
-building permit volumes have grown in recent years /92
-building permit volumes have grown in recent years /92


Housing Development Processing Times
-reduced in 2018, despite higher volume
-for affordable housing projects under the SHORT pilot program, processing times were further reduced /93
-reduced in 2018, despite higher volume
-for affordable housing projects under the SHORT pilot program, processing times were further reduced /93


-another pilot, the Applicant Supported and Assisted Process (ASAP), streamlines the outright development permit process for experienced designers and builders /94

Note: and that concludes section 2! This is more or less the halfway point. If you're still with me, you're probably in the top single digit % of the Twitterati in terms of attention span 😉
Section 3: Growth and Demand Indicators
Overview of housing demand in Vancouver, including economic trends, employment, population growth, migration, and market forces. /96
Overview of housing demand in Vancouver, including economic trends, employment, population growth, migration, and market forces. /96
GDP
-BC's GDP per capita at basic prices has remained fairly stable between 2007-2017, consistently increasing since 2009, similarly to Ontario
-Alberta's is consistently higher than both BC and Ontario over the same time period /97
-BC's GDP per capita at basic prices has remained fairly stable between 2007-2017, consistently increasing since 2009, similarly to Ontario
-Alberta's is consistently higher than both BC and Ontario over the same time period /97

Population
-between 2006 and 2016, population in CoV increased by over 50k residents
-Metro Vancouver population increased by almost 350k residents /98
-between 2006 and 2016, population in CoV increased by over 50k residents
-Metro Vancouver population increased by almost 350k residents /98

Note, because we always, always forget this: household sizes are decreasing quite rapidly in Vancouver, as they are in pretty much all cities in the developed world. Even if population remained constant, we'd still need more new housing units. /99
Inflation and Consumer Price Index (CPI)
-both overall CPI and shelter CPI increased between 2009~2018
-since 2010, CPI for all items has increased at a greater rate than CPI shelter in Metro Van
-CPI in Metro Van rose at a faster rate since 2015 than the few years previous /100
-both overall CPI and shelter CPI increased between 2009~2018
-since 2010, CPI for all items has increased at a greater rate than CPI shelter in Metro Van
-CPI in Metro Van rose at a faster rate since 2015 than the few years previous /100


Labour Force and Unemployment Rate
-the Metro Van regional labour force has grown consistently between 2006 and 2016
-the unemployment rate in Metro Van has been consistently lower than other major Canadian Census Metropolitan Areas (CMA), e.g. Toronto/Montreal /1
-the Metro Van regional labour force has grown consistently between 2006 and 2016
-the unemployment rate in Metro Van has been consistently lower than other major Canadian Census Metropolitan Areas (CMA), e.g. Toronto/Montreal /1


Migration
-in 2016, the proportion of non-migrants in the CoV was 25.8% of the population, which was lower than the Metro Van region (22.4% of the population), indicating that people moved within the CoV at a higher rate than the region as a whole /2
-in 2016, the proportion of non-migrants in the CoV was 25.8% of the population, which was lower than the Metro Van region (22.4% of the population), indicating that people moved within the CoV at a higher rate than the region as a whole /2
Note: needing to leave for a family dinner! Will continue with the rest of the Housing Data Book in the next few days.