Google had been in a healthy uptrend ever since it was launched as an #IPO. A broad $300 range developed in July 2018 and this range is still being played out.
2/16
2/16
Chart 1
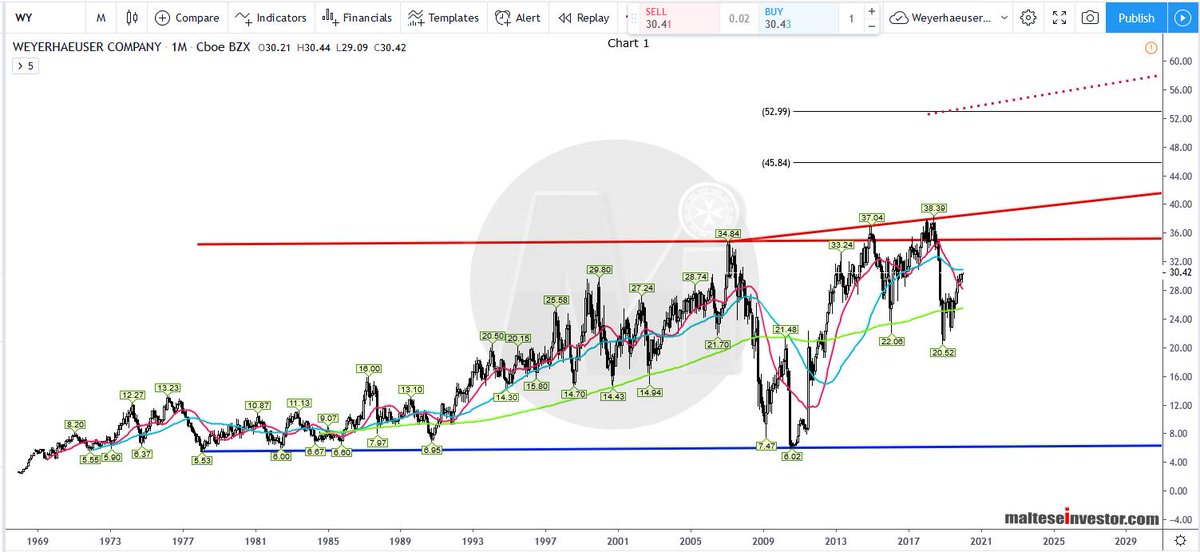
Monthly Chart: #Trendline and #trendlinepivots drawn off the most reliable closes. Horizontal #pivots off peaks act as strong support.
3/16
Monthly Chart: #Trendline and #trendlinepivots drawn off the most reliable closes. Horizontal #pivots off peaks act as strong support.
3/16
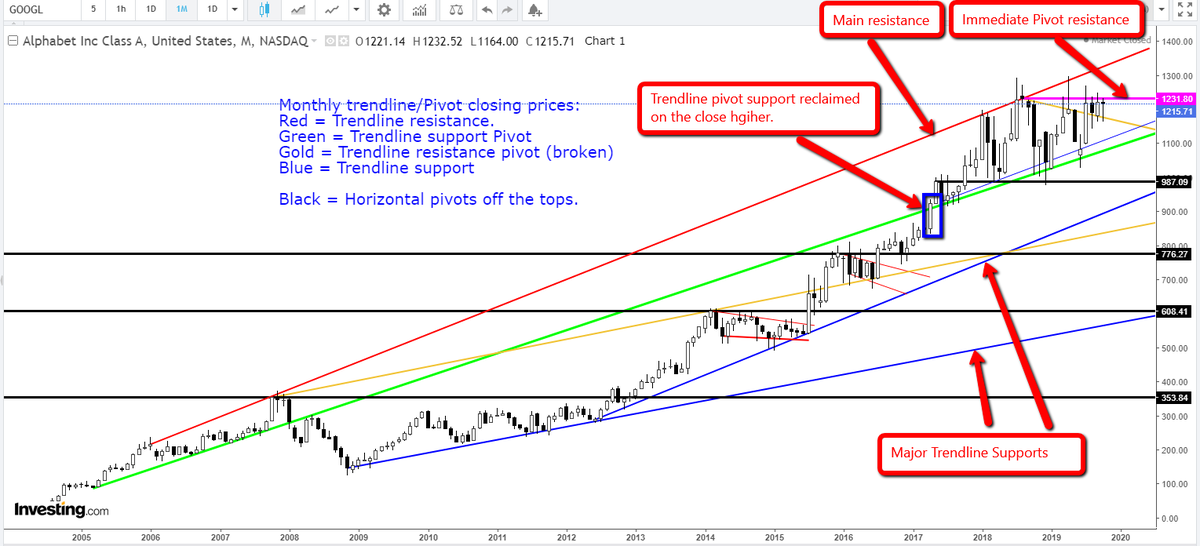
Chart 2
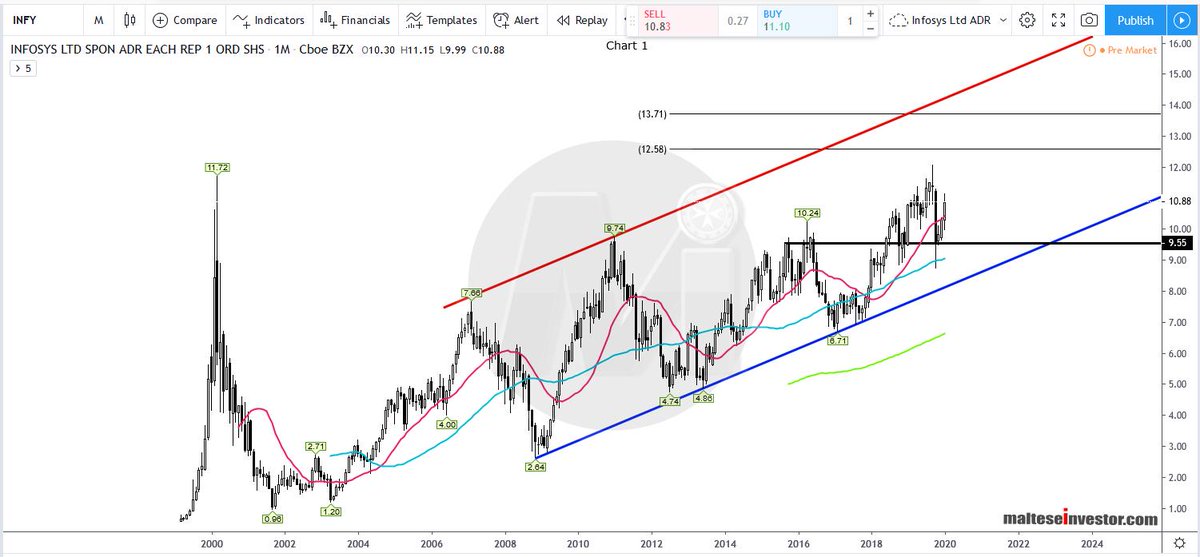
Monthly Chart: Pivot resistance (in gold) yielded and turned to support. The rising support line (green) turned resistance has turned back into support. Above here a medium TL support.based off closing prices.
4/16
Monthly Chart: Pivot resistance (in gold) yielded and turned to support. The rising support line (green) turned resistance has turned back into support. Above here a medium TL support.based off closing prices.
4/16

Chart 3
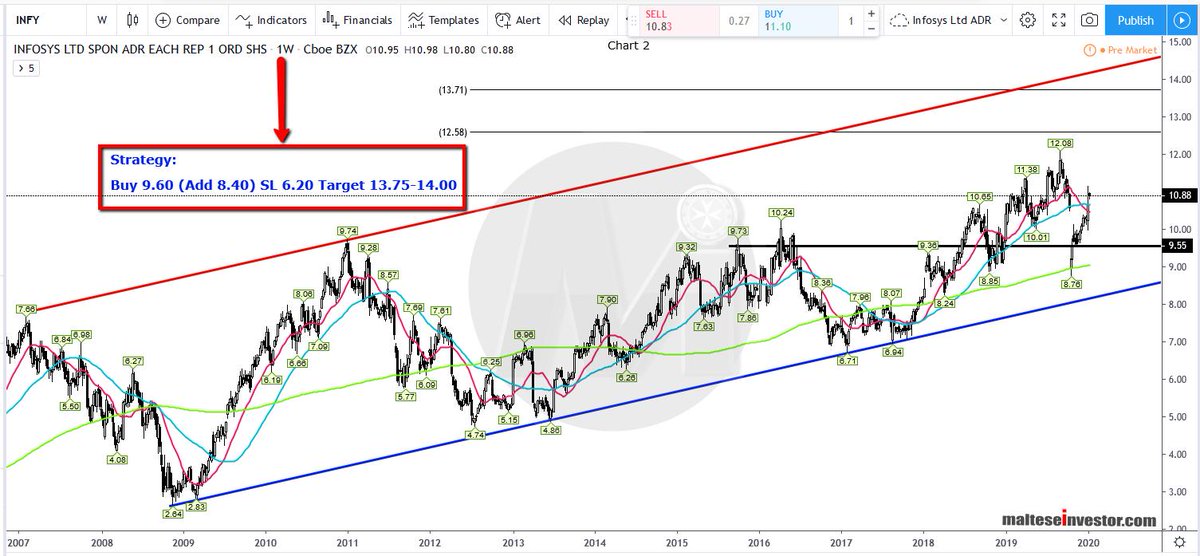
Weekly Chart: A break of the TL pivot resistance (gold) now acts as support. Multiple weekly closes above the minor TL pivot resistance is required to eventually target strong resistance extending to $1,800.
5/16
Weekly Chart: A break of the TL pivot resistance (gold) now acts as support. Multiple weekly closes above the minor TL pivot resistance is required to eventually target strong resistance extending to $1,800.
5/16

Chart 4
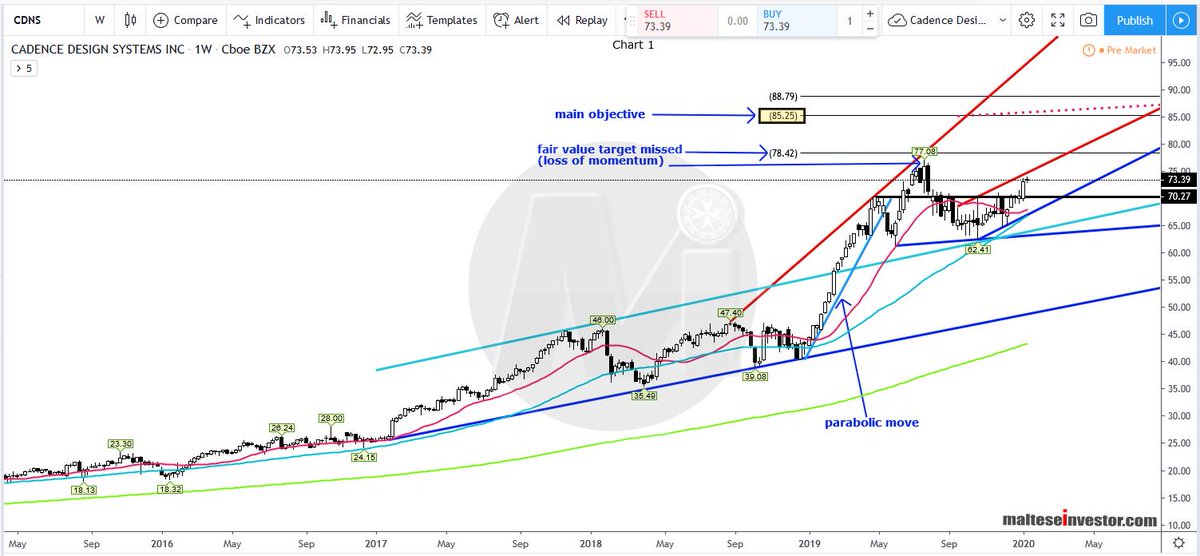
Weekly Chart: A close up of Chart 3.
6/16
Weekly Chart: A close up of Chart 3.
6/16

Chart 5
Weekly Chart: A new marginal low and high were made out of the range but prices remain trapped in the broad range. #Fibs have been added on the now swing high. Support found off the Fib 0.786% and and rising closing TL pivot.
7/16
Weekly Chart: A new marginal low and high were made out of the range but prices remain trapped in the broad range. #Fibs have been added on the now swing high. Support found off the Fib 0.786% and and rising closing TL pivot.
7/16
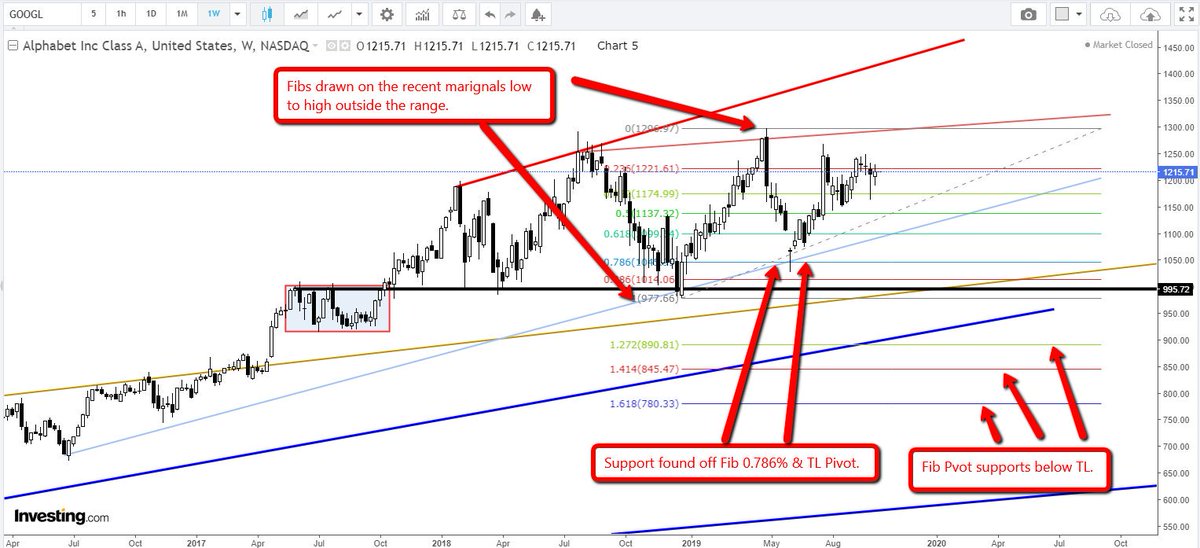
Chart 6
Weekly Chart: Inverted Fibs to calculate possible resistances above. #Confluence of Fibs 1.272%, 1.414% and the rising trendline resistance for future resistance.
8/16
Weekly Chart: Inverted Fibs to calculate possible resistances above. #Confluence of Fibs 1.272%, 1.414% and the rising trendline resistance for future resistance.
8/16
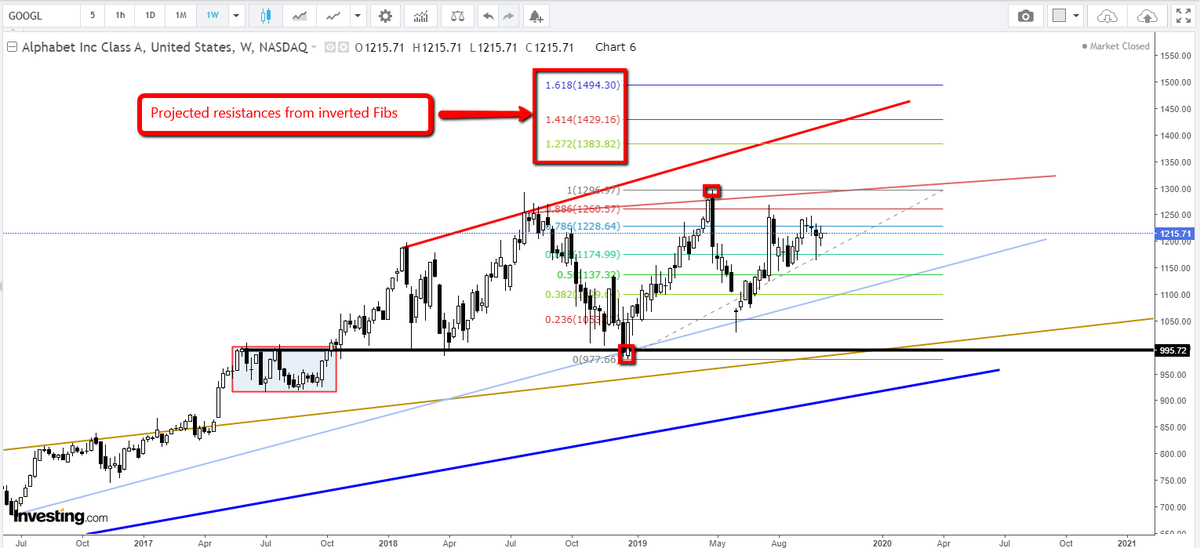
Chart 7
Daily Chart: In all it's trading history Google has always managed to close all gaps, except on 4 occasions. We shall look at these gaps closely. Below 2 unfilled gaps (purple). The red squares represent the closed gaps.
9/16
Daily Chart: In all it's trading history Google has always managed to close all gaps, except on 4 occasions. We shall look at these gaps closely. Below 2 unfilled gaps (purple). The red squares represent the closed gaps.
9/16

Chart 8
Daily Chart: More filled gaps.
10/16
Daily Chart: More filled gaps.
10/16

Chart 9
Daily Chart: More filled gaps. Another unfilled gap (in purple)
11/16
Daily Chart: More filled gaps. Another unfilled gap (in purple)
11/16

Chart 10
Daily Chart: More filled gaps.
12/16
Daily Chart: More filled gaps.
12/16

Chart 11
Daily Chart: More filled gaps and another unfilled gap. Cluster resistance broke and now acts as a support. The trendline (in teal) has yielded. ........
13/16
Daily Chart: More filled gaps and another unfilled gap. Cluster resistance broke and now acts as a support. The trendline (in teal) has yielded. ........
13/16
....... Fibs are added from the cluster break up to the July high. We are uncertain about the blue line - only time will tell if it's a trendline or trendline pivot.
14/16
14/16

Chart 12
Daily Chart: Zoomed out to see the 4 unfilled gaps which will act as support on the way down. The 0.786% is sandwiched in unfilled Gap 4. Fibs 1.272%, 1.414% and 1.618% acts as other supports below unfilled Gap 4. ....
15/16
Daily Chart: Zoomed out to see the 4 unfilled gaps which will act as support on the way down. The 0.786% is sandwiched in unfilled Gap 4. Fibs 1.272%, 1.414% and 1.618% acts as other supports below unfilled Gap 4. ....
15/16
....... The old trendline turned pivot (in teal) has been removed because it became unreliable over time.
16/16
16/16