Twitter has turned #bearish following yesterday's blowout of the main building base which began May 2019. Stale longs are now trapped within the gap (37.80-32.38) and slightly higher up at 39.50-41.00.
TWTR 2/7
TWTR 2/7
The picture has turned highly negative - 28.60 will be the next target if #trendline support at 30.00 fails to hold.
TWTR 3/7
TWTR 3/7
Chart 1
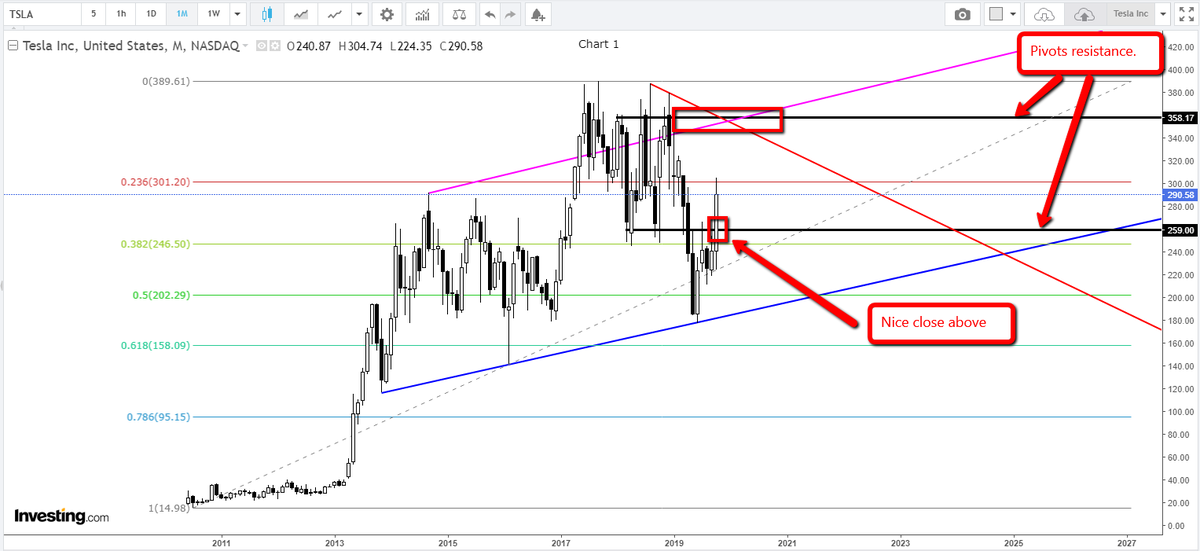
Monthly Chart: #Fibs off all time high (74.73) to low (13.72). A break/hold above Fib 0.50% failed to materialize and this has weakened bullish resolve.
TWTR 4/7
Monthly Chart: #Fibs off all time high (74.73) to low (13.72). A break/hold above Fib 0.50% failed to materialize and this has weakened bullish resolve.
TWTR 4/7
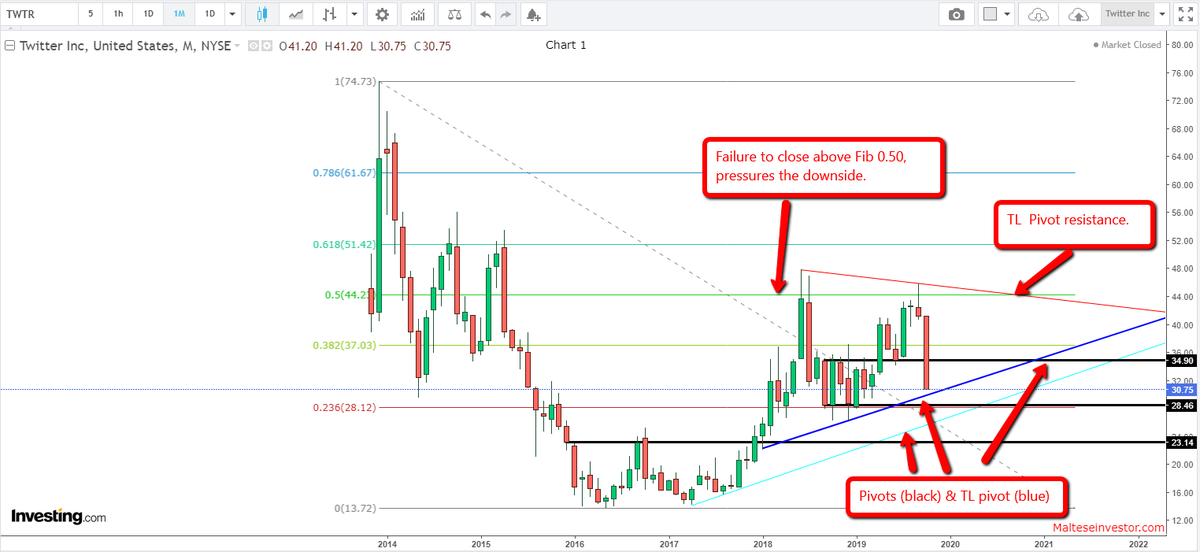
Chart 2
Weekly Chart: Trendline support from Dec 2018 has finally given way followed by a short squeeze and now just hovering above trendline #pivot support. Fibs added on the swing high commencing July 2018
TWTR 5/7
Weekly Chart: Trendline support from Dec 2018 has finally given way followed by a short squeeze and now just hovering above trendline #pivot support. Fibs added on the swing high commencing July 2018
TWTR 5/7
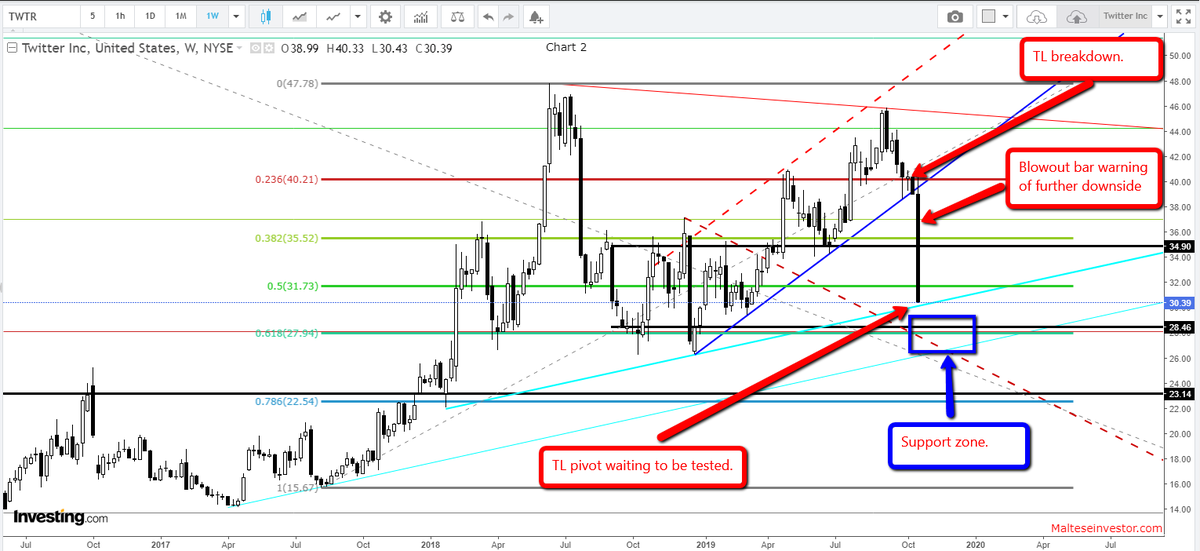
Chart 3
Daily Chart: An unfilled gap (37.80 - 32.38) has now appeared. #TL Pivot support currently being tested.
TWTR 6/7
Daily Chart: An unfilled gap (37.80 - 32.38) has now appeared. #TL Pivot support currently being tested.
TWTR 6/7
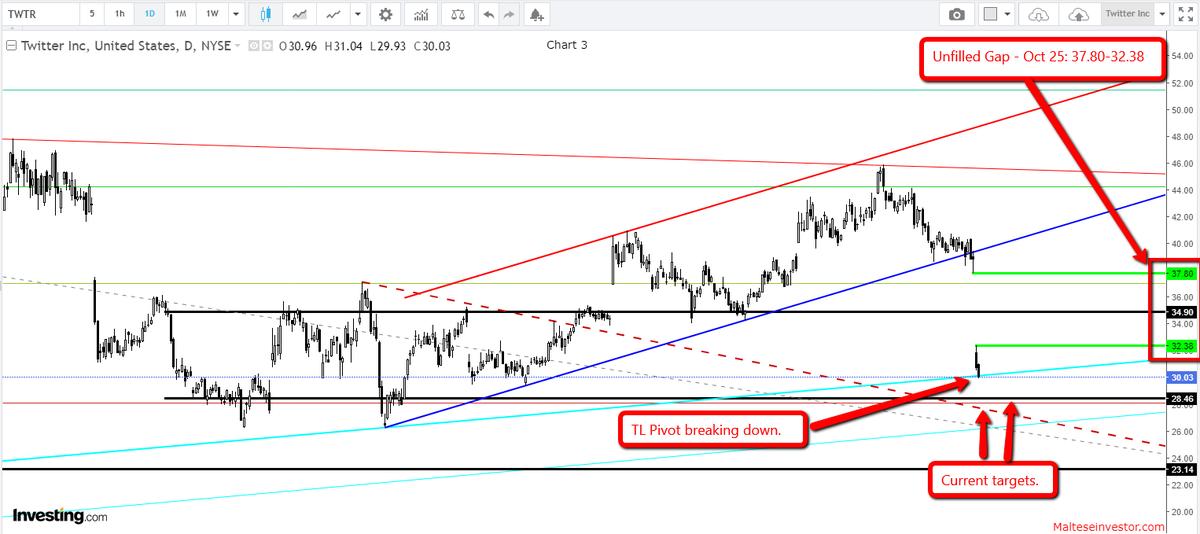
Chart 4
Daily Chart: The strategy - printed in the image.
>>Extreme caution should be applied on the short term risky trade.<<
TWTR 7/7
Daily Chart: The strategy - printed in the image.
>>Extreme caution should be applied on the short term risky trade.<<
TWTR 7/7