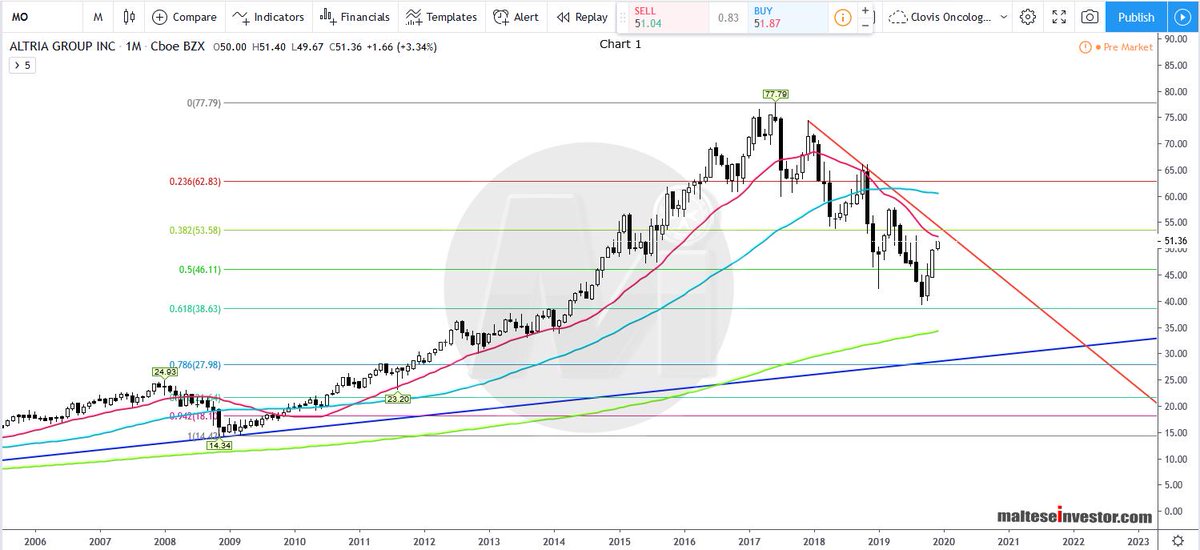
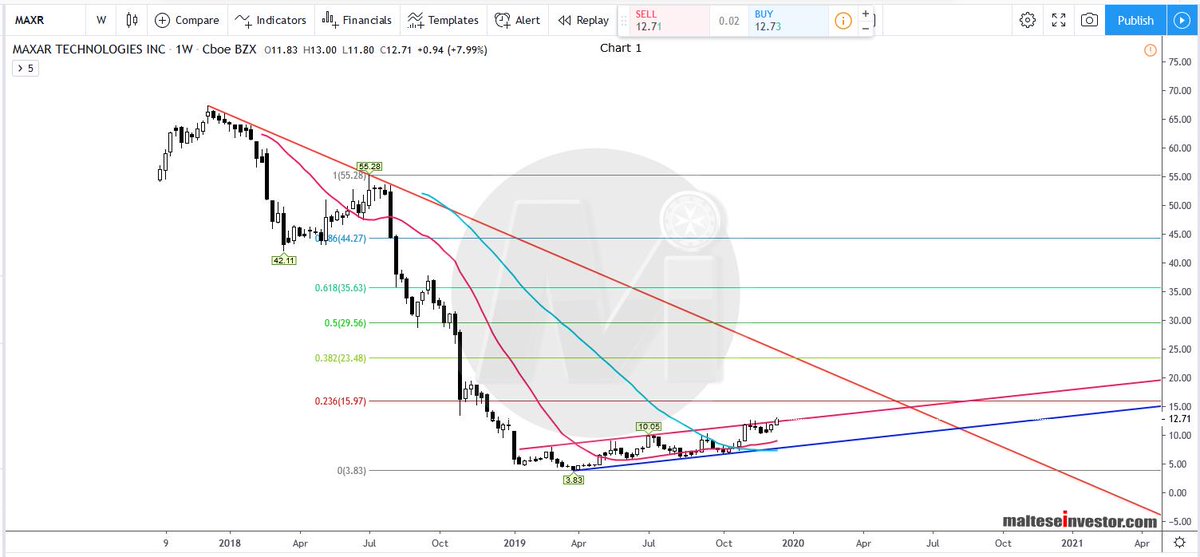
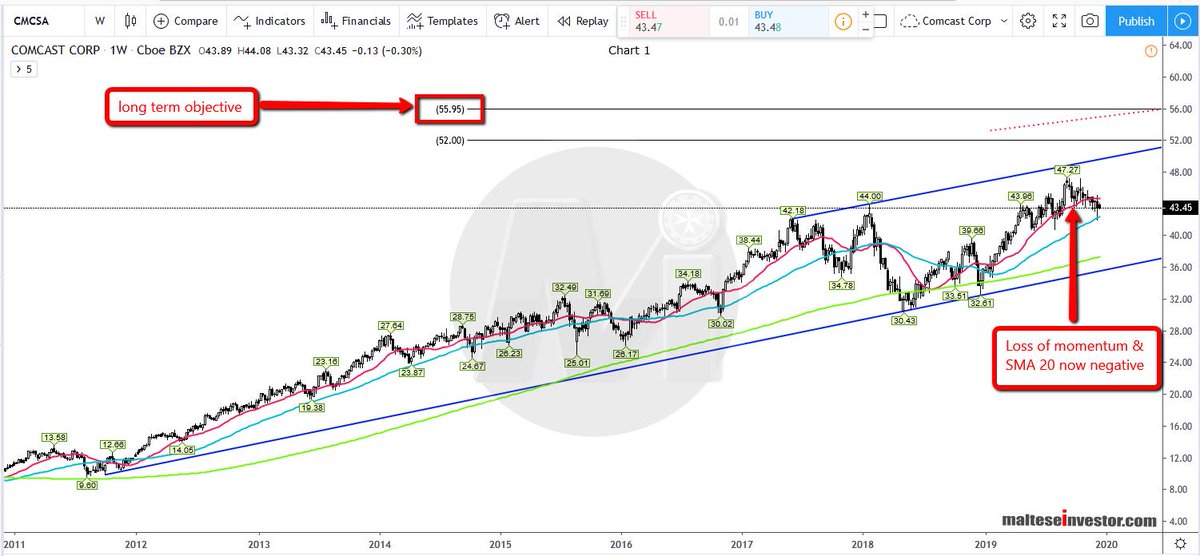
Weekly Chart: The long term is strongly bullish but short term momentum has been lost and we expect price to come lower. The #SMA 20 is acting as a mild #resistance but still notable.
CMCSA 2/3
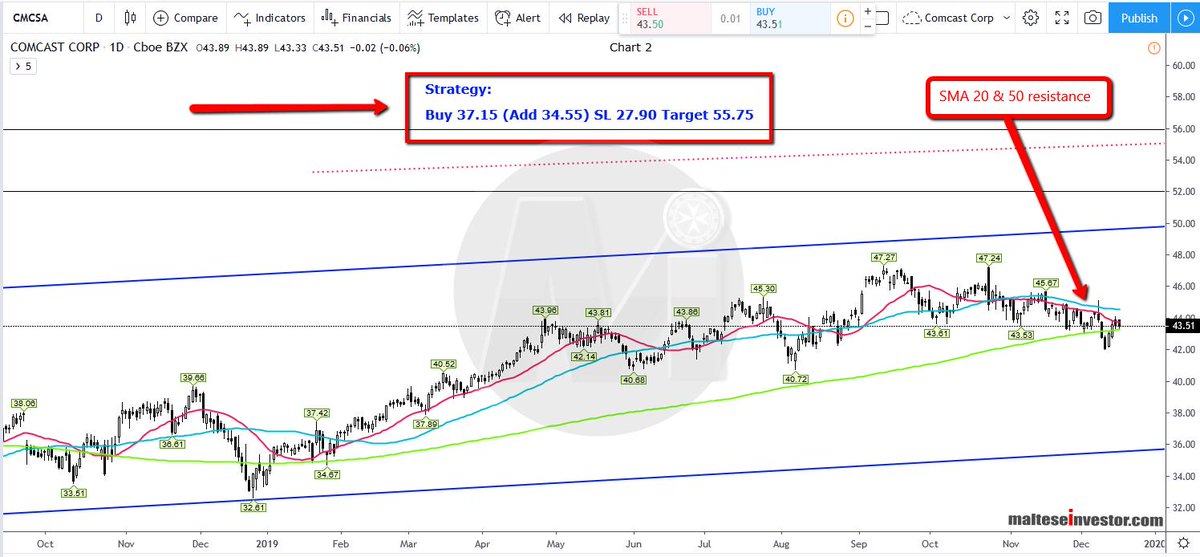
Daily Chart: Both SMA 20 & 50 are now resistance with the SMA 200 barely holding. #Trendline support seen just below 36.00.
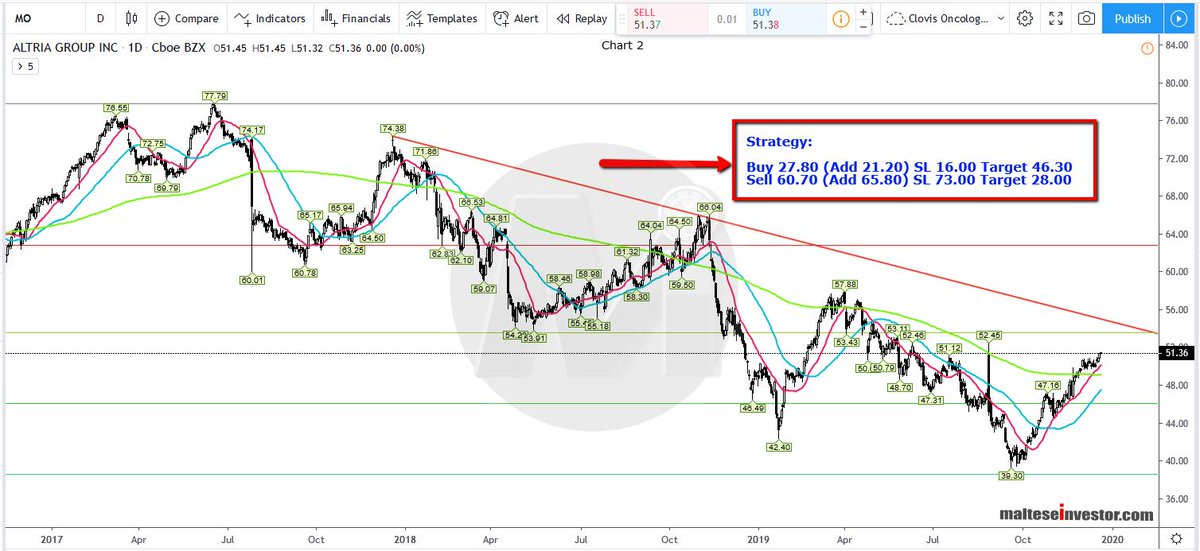
The #Strategy is printed on the image.
$CMCSA 3/3
