Chart 1
Monthly Chart: Since peaking at 77.29 in June 2017, price has drifted lower.
Strong #resistance is seen around 58.70-61.00.
The SMAs 20 & 50 are negative but the #SMA 200 at 34.27 and the long term trend, are bullish.
MO 2/3
Monthly Chart: Since peaking at 77.29 in June 2017, price has drifted lower.
Strong #resistance is seen around 58.70-61.00.
The SMAs 20 & 50 are negative but the #SMA 200 at 34.27 and the long term trend, are bullish.
MO 2/3
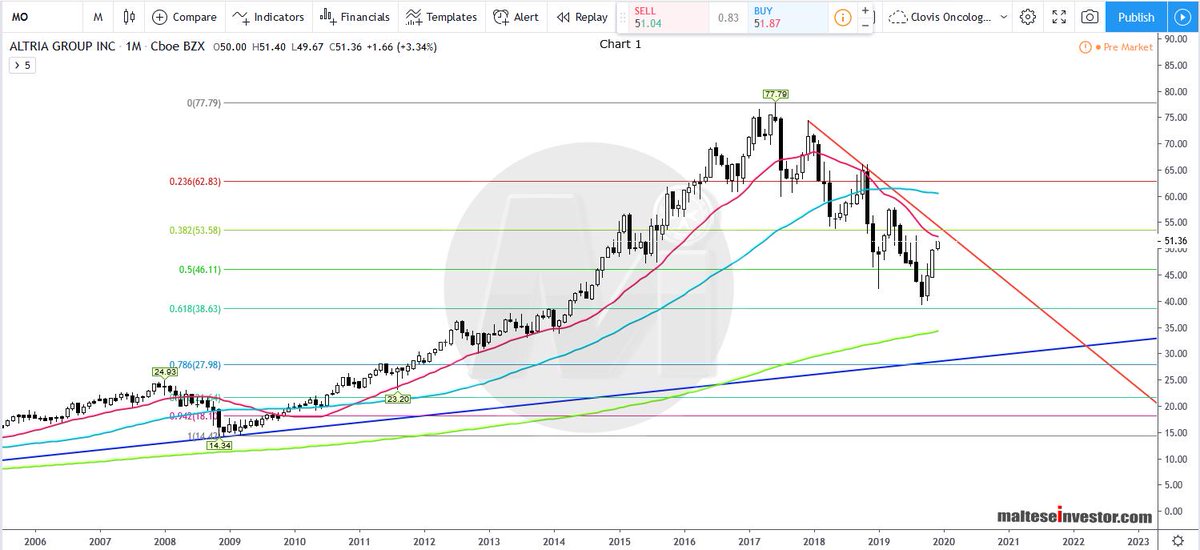
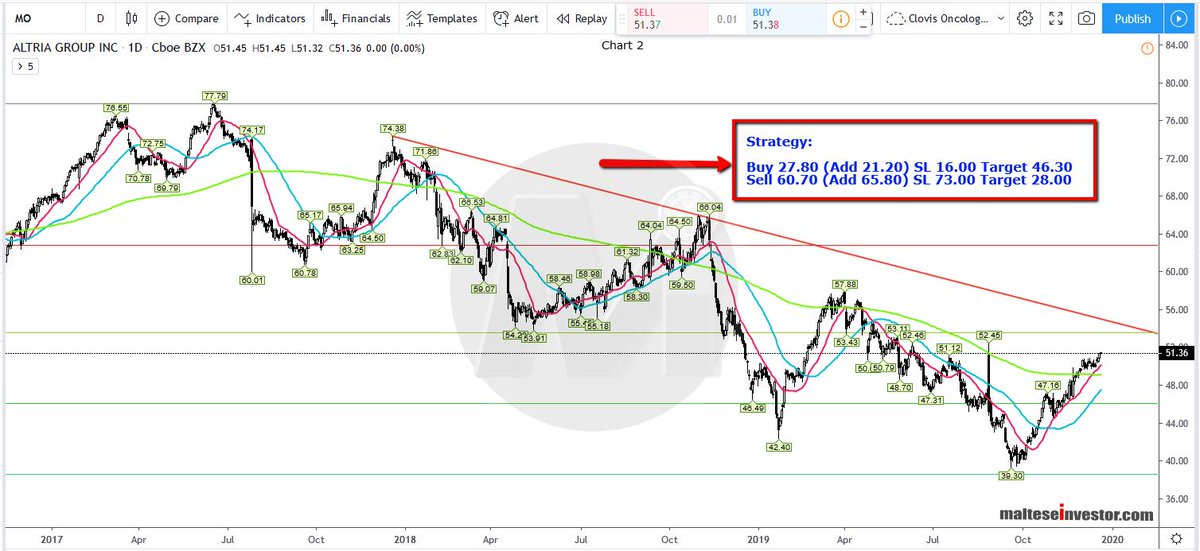
Chart 2
Daily Chart: The main SMAs are all bullish and expect #trendline resistance valued at 54.95 to yield within a couple of months.
The #Strategy is printed on the image.
$MO 3/3
Daily Chart: The main SMAs are all bullish and expect #trendline resistance valued at 54.95 to yield within a couple of months.
The #Strategy is printed on the image.
$MO 3/3