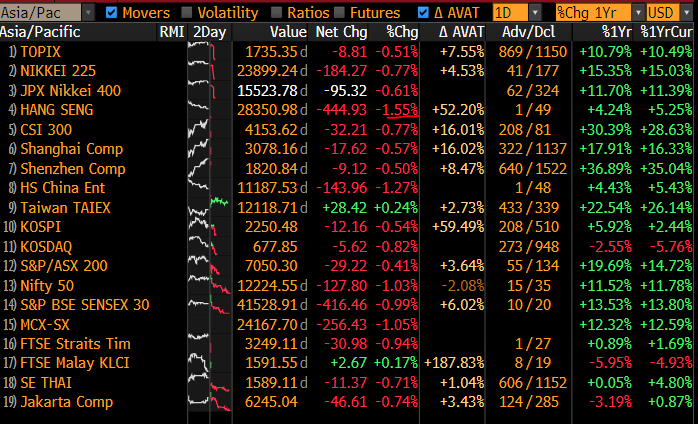
Good morning. Markets feeling infected by the Wuhan virus & totally red today in Asia, esp HSI. Apparently it moves from person to person (I got the flu & vigilant 😬🤒🤗).
Anyway, let's do some economic analysis today beyond the headlines: we'll cover base effects & seasonality
Anyway, let's do some economic analysis today beyond the headlines: we'll cover base effects & seasonality
Some headlines for you this morning:
South Korea 1st 20-day exports FELL -0.2%YoY from -2% in December. Chips up +8.7% but to China falls -4.7%.
Also Korea PPI went positive to +0.7% from negative -0.1%.
Overall, chip & low base leading the recovering. So what is a low base???
South Korea 1st 20-day exports FELL -0.2%YoY from -2% in December. Chips up +8.7% but to China falls -4.7%.
Also Korea PPI went positive to +0.7% from negative -0.1%.
Overall, chip & low base leading the recovering. So what is a low base???
Everyone talks about low base helping this cyclical recover - CAN'T GET HURT FALLING OUT OF THE BASEMENT MENTALITY.
What does that mean? It means something happened in 2019 that makes it easy to outperform statistically. Let's look at 2019 Korea export figures in USD in value 👇🏻
What does that mean? It means something happened in 2019 that makes it easy to outperform statistically. Let's look at 2019 Korea export figures in USD in value 👇🏻
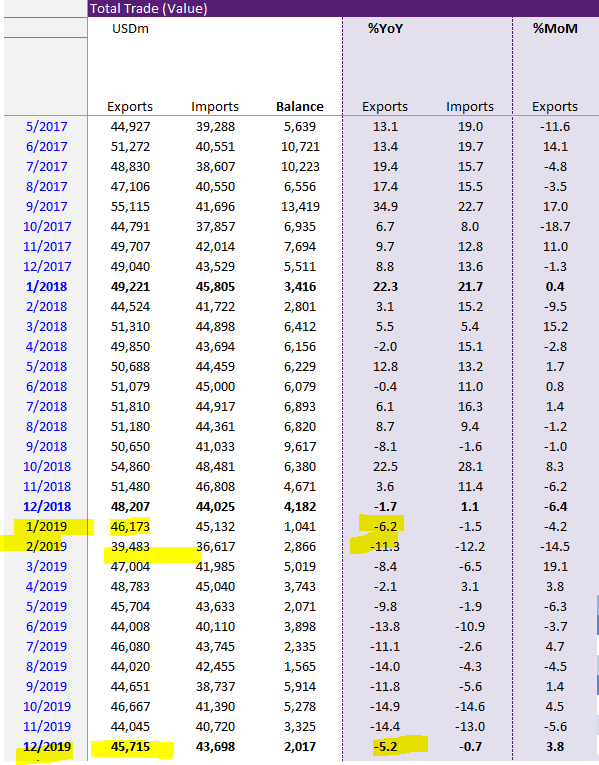
You can see some significant falling off the cliff in South Korea data let me talk about some summary statistics that may be useful:
In 2018, average monthly exports was 50,405
In 2019, average monthly exports was 45,194
A DROP of -10.3% so the ave of 2019 easy to beat in 2020
In 2018, average monthly exports was 50,405
In 2019, average monthly exports was 45,194
A DROP of -10.3% so the ave of 2019 easy to beat in 2020
If you thought that the average monthly performance of 2019 is easy to beat then February 2019 is massively easy as it was only 39,483!!!
Not only was 2019 underwhelming we got Feb data abysmal, partly because of the lunar calendar.
So that's the base, what about seasonality?
Not only was 2019 underwhelming we got Feb data abysmal, partly because of the lunar calendar.
So that's the base, what about seasonality?
Seasonality in statistics can be defined as anything that deviates from trend & caused by a peculiar seasonal factor.
Fewer working days due to change of the holiday calendar (lunar, Ramadan etc), one-off environmental disruption like the Tohoku earthquake, or school month etc!
Fewer working days due to change of the holiday calendar (lunar, Ramadan etc), one-off environmental disruption like the Tohoku earthquake, or school month etc!
So the pt of caring about whether data goes up/down is to try to understand how the economy is doing (up, down, side-way) & drivers & try to predict. Hard to do so if u don't understand distortions to the data.
Base effects is one. Another is seasonality & we got 1 coming up!
Base effects is one. Another is seasonality & we got 1 coming up!

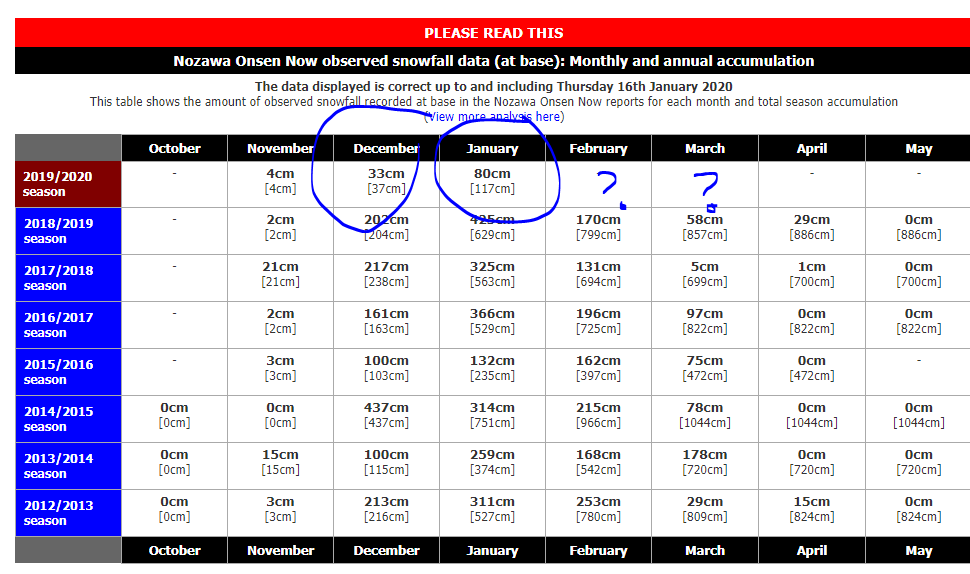
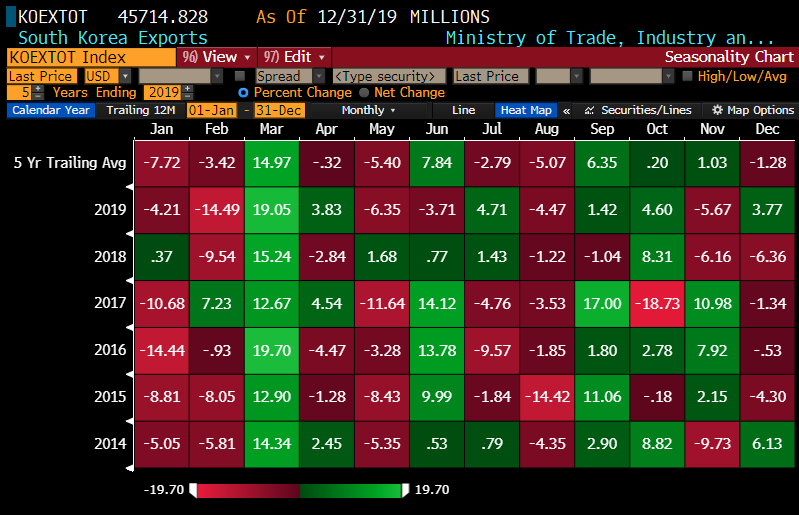
What do you see in that Christmas looking heat map? Well, you see a seasonal pattern of JAN + FEB under performing March, which magically bounces! That is b/c we use the Christian calendar but Asian people, esp Koreans, Chinese, Vietnamese, Taiwanese, etc celebrate lunar holidays
So it is a bit complicated to analyze Asian trade data in the 1st 2 months of the year & people often use the term lunar new year (LNY) or Chinese new year (CNY) to explain whatever they want to see, either up or down.
Below is China's exports seasonality map 👇🏻.
So what u say?
Below is China's exports seasonality map 👇🏻.
So what u say?
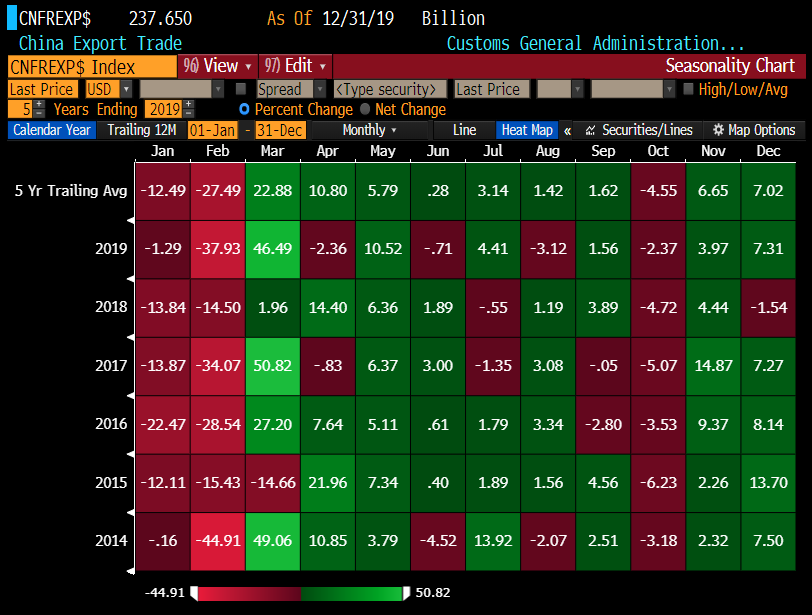
Okay: we're going to have some serious distortions of data from both base effects & Lunar New Year (earlier this yr so people are working less in Jan; celebrated LNY in Feb last year so more working days in Feb '20 vs Feb '19). Chinese exports'll super good in Feb while weak Jan!
CPI too is another data that'll be rather distorted as the festivities tend to push up demand for food & drive up food prices & since it's in Jan this year then the base effect is not favorable for CPI. As such, it'll spike! So u have to be mindful of base & seasonal distortions!
Do you know why this virus is more deadly for markets than data & geopolitics? Because likely to motivate people to stay home & rest & avoid crowded areas in case of infection.
That is the most effective way to basically infect all sectors related to going out & having fun!!👈🏻👈🏻
That is the most effective way to basically infect all sectors related to going out & having fun!!👈🏻👈🏻