1/ I knew I had to add convexity in my portfolio for a long time. After an amazing 2019, I began 2020 learning about options to try to implement a tail hedging strategy. Given all the uncertainty right now I believe others might benefit from what I learned. Thread 🧵👇
2/ To be clear, this is work in progress. Feedback is welcome. I still have many points to improve but I believe that I am reasonably protected against a potential crisis.
3/ Another important point. I am not trying to predict when the crisis will happen. I want to add convexity regardless of what I think about the future. The fact that a crisis can happen anytime is enough for me.
4/ I became aware of the convexity principle by reading @nntaleb books. But I never actually put it in practice in my financial portfolio until now. Better late than never.
@nntaleb 5/ The second big influence on me was the book written by Mark Spitznagel named "The Dao of Capital". Amazing book. It superficially discuss a tail hedging strategy that made sense to me. amazon.com/Dao-Capital-Au…
@nntaleb 6/ The strategy discussed in the book is more accessible and well described in the following article from @jessefelder thefelderreport.com/2016/08/15/wor…
@nntaleb @jessefelder 7/ However, I quickly realized that the strategy discussed in the book and the article above was not enough to really keep you protected at all times. The authors of course know this and probably do a more nuanced approach themselves.
@nntaleb @jessefelder 8/ I then realized that if I really wanted to do it properly I should learn how to do it myself and this thread will describe which challenges I faced as well as the challenging I am facing now, along with my thinking process and decisions.
@nntaleb @jessefelder 9/ This radical sharing approach is a bit new to me. I was inspired by the following @Suhail thread, which for me is @twitter at its best.
@nntaleb @jessefelder @Suhail @Twitter 10/ The main idea of the strategy mentioned above is simple: Lets use 0.5% of portfolio value to buy far out of the money SPX put option so that our portfolio breaks even under a 20% drop within 30 days assuming the rest 99.5% is invested in SP500.
@nntaleb @jessefelder @Suhail @Twitter 11/ @jessefelder then show in a nice practical example that buying 30% below spot price 2-month put options actually deliver the desired result.
@nntaleb @jessefelder @Suhail @Twitter 12/ I will show later that although the illustration is correct there are important improvements to be made for it to be useful in practice.
But first I want to stop and explain why this initial strategy was so helpful to me.
But first I want to stop and explain why this initial strategy was so helpful to me.
@nntaleb @jessefelder @Suhail @Twitter 13/ Tail-hedging is like buying insurance. To buy insurance you need to know what you want to be insured against. Before reading the book and article, it was not exactly clear what to protect against.
Protect against a financial crisis is too broad and abstract.
Protect against a financial crisis is too broad and abstract.
@nntaleb @jessefelder @Suhail @Twitter 14/ Protecting against 20% drop within 30 days is specific and concrete. It states magnitude and time-frame. Both are very important.
@nntaleb @jessefelder @Suhail @Twitter 15/ Another benefit for me was that I started to implement the strategy at the end of 2019, even though I noticed that it was sub-optimal.
Once your money is on the line you have a big motivation to learn and improve.
Once your money is on the line you have a big motivation to learn and improve.
@nntaleb @jessefelder @Suhail @Twitter 16/ So now I had a (allegedly) sub-optimal strategy in place that needed improvement and questions that needed answers.
@nntaleb @jessefelder @Suhail @Twitter 17/ Some questions:
Buying side: 30% out of the money 2-month put might be ok given certain conditions but not under all conditions.
I needed to know X, Y in X% OTM given Y days to expiration given current conditions (implied vol, interest, etc).
Buying side: 30% out of the money 2-month put might be ok given certain conditions but not under all conditions.
I needed to know X, Y in X% OTM given Y days to expiration given current conditions (implied vol, interest, etc).
@nntaleb @jessefelder @Suhail @Twitter 18/ Holding and selling side: The first approach suggested to sell the options and buy new ones after 30 days. This is the weakest part of the strategy that needed improvement.
@nntaleb @jessefelder @Suhail @Twitter 19/ If you but N options with 60 days to expiration to protect you against 20% drop within 30 days, and nothing significant happens in the period, the option protection power will decay with time and will not be protecting you enough at the end of the period.
@nntaleb @jessefelder @Suhail @Twitter 20/ So it was clear that a more dynamic approach would be necessary, one where I would know which options to buy in addition to restore the protective power of the options.
@nntaleb @jessefelder @Suhail @Twitter 21/ And then there was the hardest of all, when to sell. I could simply implement the default of selling any set of options after 30 days of the buy period, but this would leave a lot of money on the table and increase the cost of the strategy under normal conditions.
@nntaleb @jessefelder @Suhail @Twitter 22/ A much better approach is to know when I got more than my fair share of protection and sell the surplus. This would allow me to make money not only in the hell scenario but also on false alarm, with 4+% drop. Like is happening today actually.
23/ But the most important point on the sell side is to know when and what to sell. I cannot sell to the point of removing my protection mid-way through a crisis as it would defeat the purpose of the strategy.
24/ Now that you have an idea of the questions being asked we can start to describe how I approached the problem.
To start, I needed data.
To start, I needed data.
25/ Up to this point I have mostly traded futures. I had no historical data about options. Finding a reliable and reasonably priced place to buy the data was harder than I thought.
After searching a bit I decided to buy it from historicaloptiondata.com
After searching a bit I decided to buy it from historicaloptiondata.com
26/ I bought SPX option data going back to 1991 for around $500.
Maybe I could have found better deals but I did not want to spend too much time shopping around.
Maybe I could have found better deals but I did not want to spend too much time shopping around.
27/ Each year contains daily data with option prices (different strikes and expiration dates). The year 2018 has 870.275 lines for example.
28/ There was an implied volatility column in the data, but I soon realized that that part of the data was unreliable. The prices seemed ok.
So my first task was to compute the implied volatility data from the price data using a vanilla Black-Scholes model.
So my first task was to compute the implied volatility data from the price data using a vanilla Black-Scholes model.
29/ This required optimization as there was no closed-form solution to go from price -> implied volatility.
After a quick search I found some libraries that claimed to do it but I did not find one that seemed well maintained/documented.
After a quick search I found some libraries that claimed to do it but I did not find one that seemed well maintained/documented.
30/ So I decided to do it myself. Since I had all the other BS parameters, it was simply a univariate optimization problem.
This actually took more time than I expected as my optimization kept diverging for some combinations of strike, expiration and price.
This actually took more time than I expected as my optimization kept diverging for some combinations of strike, expiration and price.
31/ After some adjustment I finally got it to work properly. I now had price and implied volatility for all the data points.
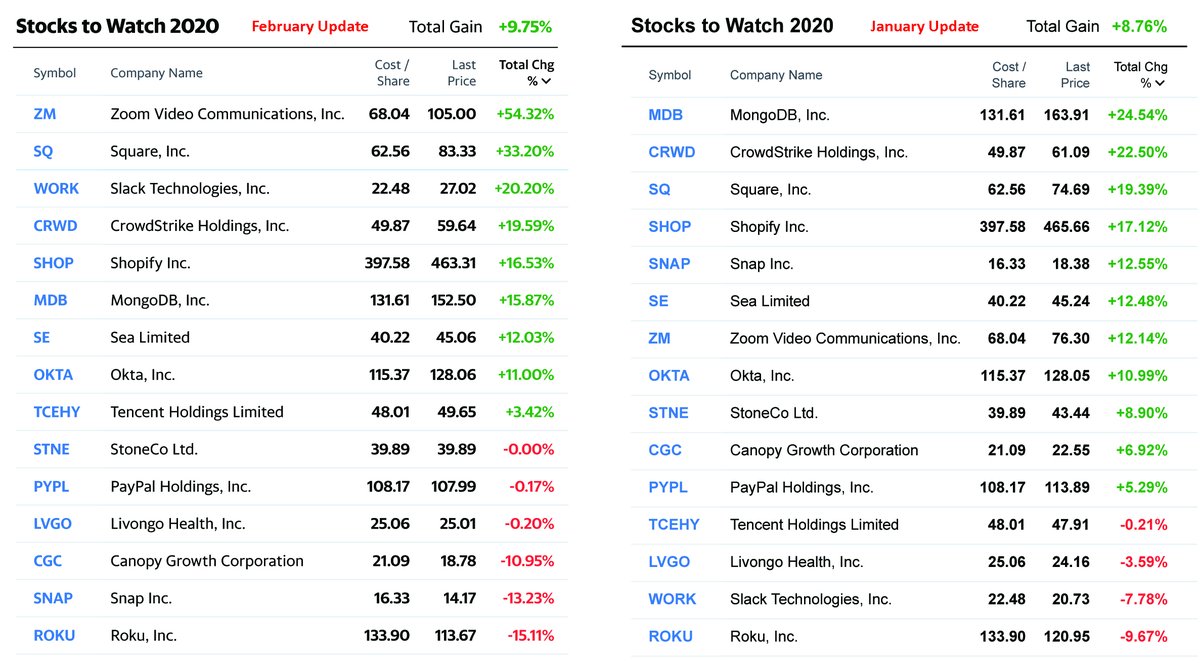
32/ The timing of this project was good. The put options I bought as part of this strategy are up 1500% at this point.
More than enough to cover the loss at the remaining parts of the portfolio, which is the point of all this. I will resume the thread later.
More than enough to cover the loss at the remaining parts of the portfolio, which is the point of all this. I will resume the thread later.
33/ This week has been a roller coaster. I saw my tail hedging strategy oscillating from 0% to 3500% in a few days.
It was amazing to see how a tiny 0.5% of the portfolio can add a 17.5% slice into your overall portfolio but also how quickly it can disappear.
It was amazing to see how a tiny 0.5% of the portfolio can add a 17.5% slice into your overall portfolio but also how quickly it can disappear.
34/ I got lucky to start learning and experimenting with this a few months prior to a big correction.
Not because of the financial results but because I could learn in practice how stressful it can be if you are not psychologically prepared.
Not because of the financial results but because I could learn in practice how stressful it can be if you are not psychologically prepared.
35/ When you see a 3500% return, it is very easy to forget that the point of the strategy is to give you tail risk (which can be of unknown proportions) protection.
It is NOT about making a quick profit when things move in your favor.
It is NOT about making a quick profit when things move in your favor.
36/ I think I got the math right from the beginning but the psychology of it can only be learned when you see your money going up and down while decisions need to be made.
I will continue to update the technical part when things calm down. Let's see what the next week brings.
I will continue to update the technical part when things calm down. Let's see what the next week brings.
37/ This is now part of financial history.
"It was the Fed’s first emergency rate cut since 2008 at the height of the financial crisis, underscoring how grave the central bank views the fast-evolving situation."
reuters.com/article/us-usa…
"It was the Fed’s first emergency rate cut since 2008 at the height of the financial crisis, underscoring how grave the central bank views the fast-evolving situation."
reuters.com/article/us-usa…
39/ I have learned a lot since last Friday. Amazing how much you learn when you have to. But there is still too much to do, hope to be able to share soon.
40/ But one newly discovered challenged I faced was to realized that the brokers stop to function when panic and activity is high. It is not fun to be unable to trade when volatility is sky high.
Anyway, this needs to be taken into account.
Anyway, this needs to be taken into account.
41/ Another strange things happened today. I was coincidentally logged into my account when the fed had the emergency meeting.
Out of nowhere all the liquidity disappeared. I knew that something big happened just by looking at the prices. Only later I realized what happened.
Out of nowhere all the liquidity disappeared. I knew that something big happened just by looking at the prices. Only later I realized what happened.
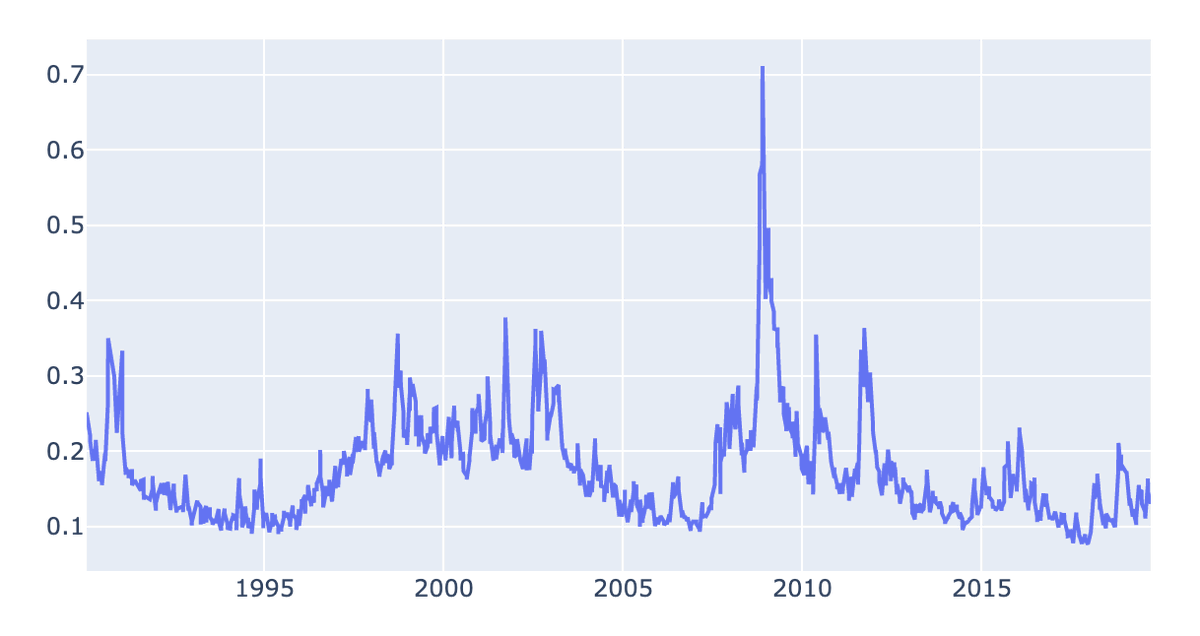
42/ Now we can get back to the technical stuff. Now that I have historical implied volatility I could start building from there.
43/ Here is a graph of the implied volatility data I computed from the historical prices. 
44/ Keeping in mind our goal stated below, we need to know WHICH put options to buy (strike and expiration date) and HOW MUCH to buy to have the appropriate coverage.
45/ In order to make those decisions we need to estimate the future price of the put options available today GIVEN a drop of 20% in the index within 30 days.
46/ IMPORTANT: We are not trying to predict how much or when the market will fall. We want to understand how the market usually behaves GIVEN a drop of 20% within the period of 30 days. That is a MUCH EASIER problem to solve.
47/ Here is an example. This graph shows the price appreciation expected from a 30% out of the money put option under a calm period (low volatility).
In this case we see that an option with 52 days from expiration would give me approx 50 times payout.
In this case we see that an option with 52 days from expiration would give me approx 50 times payout.
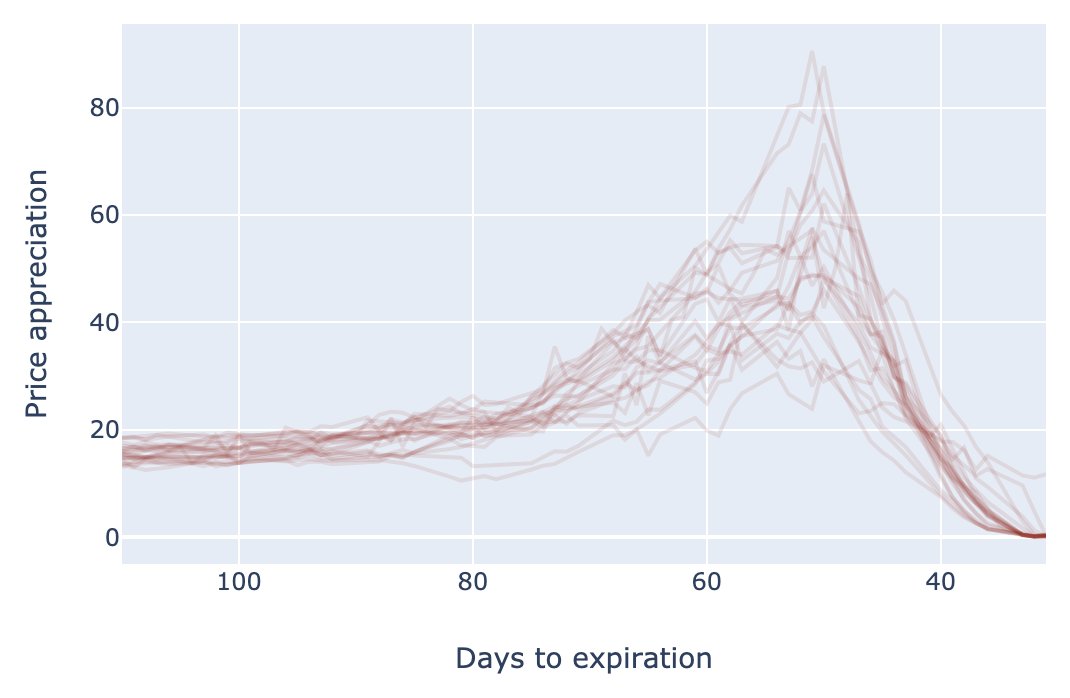
48/ This kind of information tells me which option to buy and how much. All that I need to get in the game.
49/ This is dynamic, meaning that a different picture emerges if a change strike and volatility level for example. If a volatility spike occur the price appreciation will decrease and maybe the same option will now give you a 20 times payout.
50/ This basically means that you now need to put more money on the game if you were not in. That is, the insurance gets more expensive under high volatility, which is expected.
If you were in, you can realize part of the profit and continue the game. More on that later.
If you were in, you can realize part of the profit and continue the game. More on that later.
51/ This also shows where the numbers below come from. Under peace time with low volatility you can easily get put options with 50-60 days to maturity that pays you 40 times or more under the stated coverage goal.
52/ However, the picture changes under stress and the time decay force you to roll-over (sell current option and buy new ones) much more often than 30 days as stated in the article mentioned before.
thefelderreport.com/2016/08/15/wor…
thefelderreport.com/2016/08/15/wor…
53/ As I said before, to compute the expected price appreciation I need to estimate the future option prices given 20% drop within 30 days.
54/ To do that we need to build a model that uses historical implied volatility data to predict the future implied for different strikes given the 20% drop within 30 days and relevant variables such as the current implied volatility levels, interest rates, days to expiration, etc
55/ Again, this is a conditional probability given a specific event. Much easier than trying to predict the likelihood of the event happening.