Tough choices for governments in managing COVID-19.
With apologies to @olivierveran here are some sketches which I think illustrate options. We are plotting number of cases on y against time on x.
Firstly the do nothing option is the blue curve in this graph.
With apologies to @olivierveran here are some sketches which I think illustrate options. We are plotting number of cases on y against time on x.
Firstly the do nothing option is the blue curve in this graph.
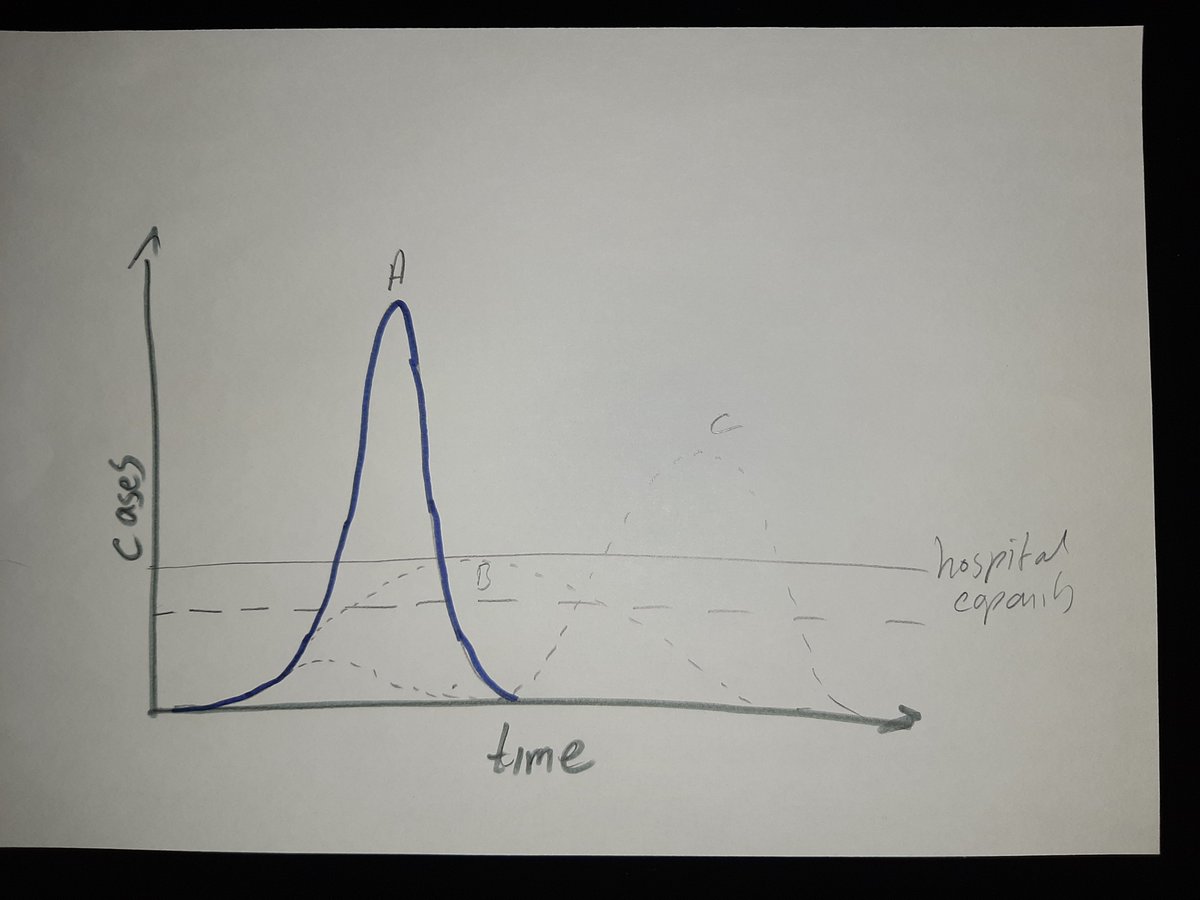
The reason that is so bad is that at peak the number if cases would be well above the capacity - red line - of the healthcare system to cope. Insufficent ventilators, beds and staff would lead to higher proportion of cases dying than would otherwise be the case.
/2
/2

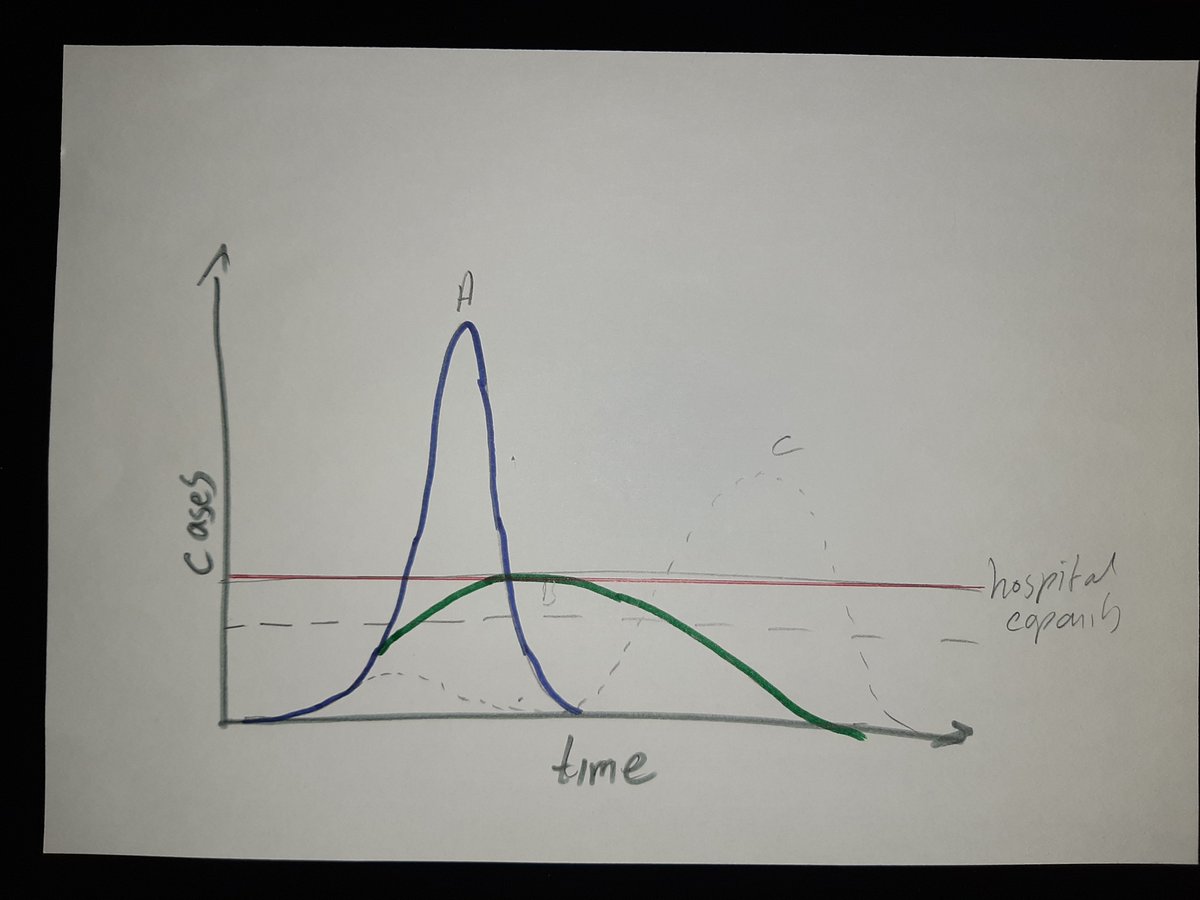
Govs want to "flatten the curve" so cases develop like the green curve. Even if the total number of cases were the same as in the blue curve, the fatality rate would be lower as hospitals could cope better: the max number of cases never exceeds healthcare capacity red line).
/3
/3
To flatten the curve you need to reduce infection rate by social distancing cancelling events, closing schools etc. But what happens if you take such action too soon? Well potentially you get the grey curve with apparent early success undermined by later resurgence.
/4
/4
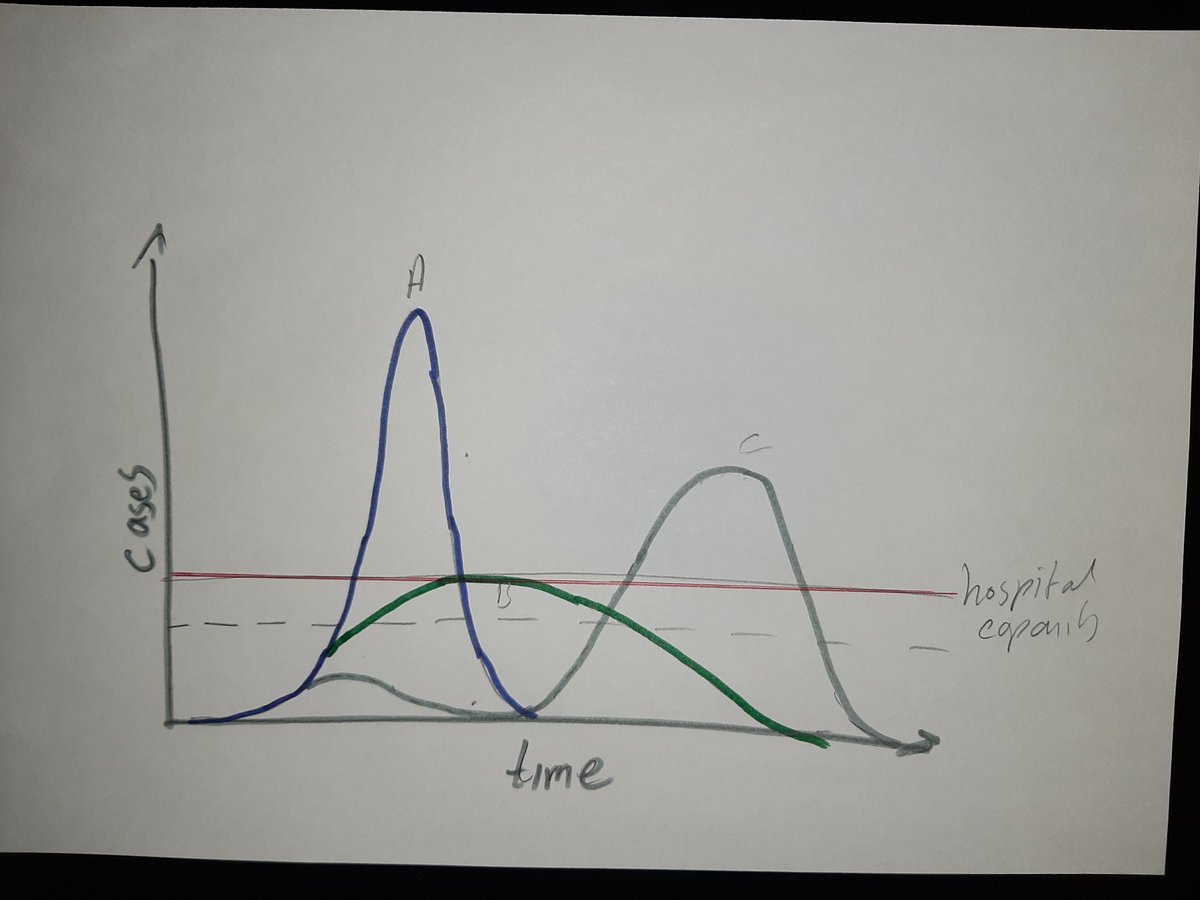
The UK's relative inaction seems aimed at avoiding the long economic hit of the grey curve. In fact some UK epidemiologists are expecting to see resurgence in the Asian countries that appear to have it under control.
/5
/5
But it is hard to know exactly what the healthcare capacity is eg can you buy enough extra ventilators or put in place more beds? Flattenig the curve enough to avoid exceeding capacity is tough: capacity could be the dashed red line rather than the solid red line.
/6
/6

Here is the policy conundrum. Even if the UK could model the disease perfectly so as to follow the green flattened curve, it could be very unpopular if neighbouring countries are following the grey curve, because UK death rates would be higher in the first few months
/7
/7
And what if better approaches to managing the illness emerge over coming months? Could the resurgence end up being easier to cope with than people currently speculate? In which case the grey curve wouldn't be so bad.
Tough times for those making these decisions.
/8
Tough times for those making these decisions.
/8

And in practice, because the public can see what is going in in other countries there is less national decision making autonomy than it might at first seem. Public opinion is likely to cause some international harmonisation of approach.
/9
/9
A caveat: the sketched curves are illustrative. There will be complex mathematical models used to generate the ones used to inform policy. These models will have numerous assumptions with varying degrees of uncertainty. Sensitive analysis of these models must be fascinating.
/10
/10