This is a thread about how to interpret the seemingly sudden appearance of #COVID19 across the much of the US in the past week with some back-of-the-envelop calculations for number of current infections. 1/13 
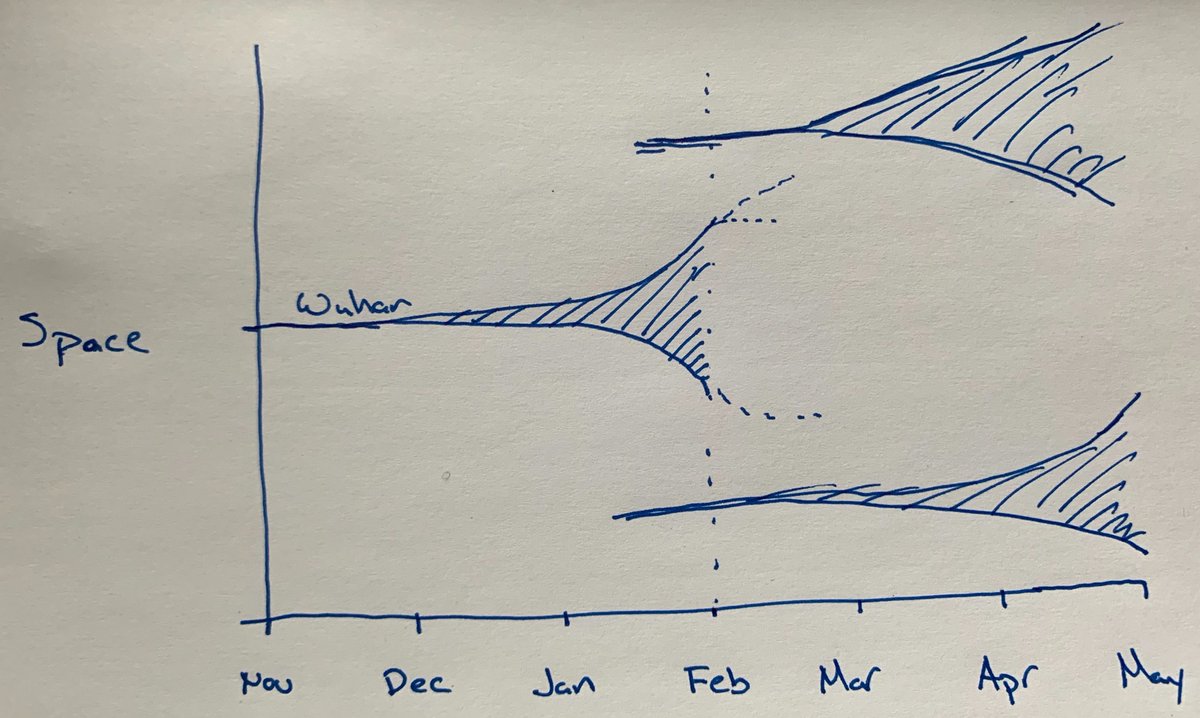
I posted back in Feb 8 with this simple model (), in which the Wuhan outbreak took from Nov to mid-Jan to grow big enough to throw off sparks and that we should expect another ~10 weeks for these sparks to grow into fires. 2/13
Although it looks like I was off by a week or two, I think the basic model was sound. Outbreaks that we're seeing across the US now are likely the result of sparks that landed in mid-Jan to mid-Feb that through exponential growth have become localized "fires". 3/13
I believe that a 5-6 day doubling is an accurate model for growth, so that sparks that landed in mid-Jan may have grown to ~2000 infections at this point and sparks that arrived in mid-Feb may have grown to ~50 infections at this point. 4/13
The seeming sudden appearance of outbreaks across the US are not due to a sudden influx of cases. Instead, transmission chains have been percolating for 4-8 weeks now and we're just now starting to see exponential growth pick up steam. 5/13
Colleagues at @MRC_Outbreak estimate that sensitivity to detect a travel export from Wuhan was only about 1 in 4 internationally, mainly due to spectrum of disease severity (report 6 imperial.ac.uk/mrc-global-inf…). 6/13
Given that the US detected 15 cases from Jan 15 to Feb 15, we might very roughly expect 45 other mild cases that arrived and were not picked up by surveillance. 7/13
Many of these ~45 cases that arrived will have fizzled without causing downstream transmission, but still a number of these likely caught hold. 8/13
Thus, a rough guess would be a ~20 sparks that caught between Jan 15 and Feb 15 and have resulted in growing outbreaks, each of which on average will be around ~1000 infections, some bigger than others. This would be an extremely rough ~20k infections in the USA. 9/13
This fits with estimates of a rough 1 to 10 case to infection reporting rate and a currently reported 1875 cases. nytimes.com/interactive/20… 10/13
I could easily be off 2-fold in either direction, but my best guess is that we're currently in the 10,000 to 40,000 range nationally. 11/13
Again, there are a bunch of assumptions here, and the main point is not the ~20k number, but instead that what we're seeing now are not new introductions, but small outbreaks that have been growing locally over the past ~8 weeks and now getting big enough to be noticed. 12/13