My Authors
Read all threads
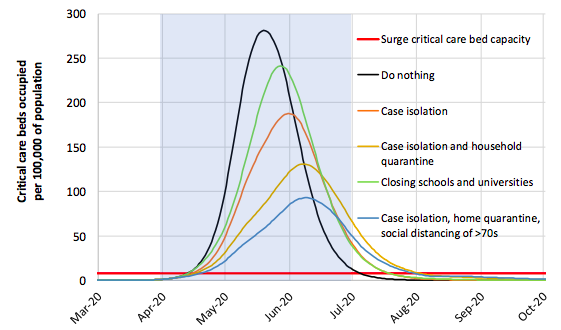
This is the key terrifying graph from the latest @imperialcollege #covidー19uk modelling. The red line right at the bottom is the max number of ICU beds. Note, that we've been on the "do nothing" upper black line trajectory until pretty much today
This is what exponential growth looks like. A rocket taking off. So much was fudged & obfuscated today, but Johnson did say we have entered the "acceleration" period. Notice how on the graph, we are still safely under the red line right now...
Vital interventions that could have been taken have not been taken. Look at the curve. Actions matter. But mass events - @stereophonics concerts! - were held this w'end because of lack of govt leadership. It has to be held to account & today's press conference was v worrying eg
Missing some Tweet in this thread? You can try to force a refresh.

Enjoying this thread?

Keep Current with Carole Cadwalladr

Profile picture

Stay in touch and get notified when new unrolls are available from this author!

Read all threads

This Thread may be Removed Anytime!

Twitter may remove this content at anytime, convert it as a PDF, save and print for later use!

Try unrolling a thread yourself!

how to unroll video

1) Follow Thread Reader App on Twitter so you can easily mention us!

2) Go to a Twitter thread (series of Tweets by the same owner) and mention us with a keyword "unroll" @threadreaderapp unroll

You can practice here first or read more on our help page!

Follow Us on Twitter!

Did Thread Reader help you today?

Support us! We are indie developers!


This site is made by just three indie developers on a laptop doing marketing, support and development! Read more about the story.

Become a Premium Member ($3.00/month or $30.00/year) and get exclusive features!

Become Premium

Too expensive? Make a small donation by buying us coffee ($5) or help with server cost ($10)

Donate via Paypal Become our Patreon

Thank you for your support!