It was sometime around 2004-2008 (that is not important in context with the story) when I was employed with one of the largest Debt Market Brokerage firm in their Institutional Equities division as a Chief Technical Strategist
In terms of Candlestick Charting, I was literally an "Abandoned Baby"🤣🤣.
So here I was, supposed to service institutional clients without support from any colleague.
Everyone gave top 5 price gainers losers, volume gainers losers or FII/DII activity or previous days foreign market changes blah blah.
Remember those were pre smartphone days &
However for our company due to our large footprint in Debt Market as a broker, Bank Treasuries were at par
The Bank Treasuries were huge when it came to Debt / FX those days and banks like Bank India & Allahabad Bank was considered a market movers only inferior to LIC & SBI in debt markets.
But does having a rifle with scope at home make you a SNIPER?
Meanwhile, I finalised my daily report / weekly report / monthly report formats and went to show the final draft to "IC" who conveniently passed the buck to Head of Sales, who
Wow, I thought I was the main tyre and discovered that I was actually a stepney.🤣🤣🤣🤣
Buoyed by the reception of Case Studies, I wrote my first ever Index Case study in May'06 with a "SELL" and accidentally released it a day before it peaked.
Lesson: Do your job
Lesson: Believe in Destiny but first believe in self
Thanks for reading 🙏🙏🙏
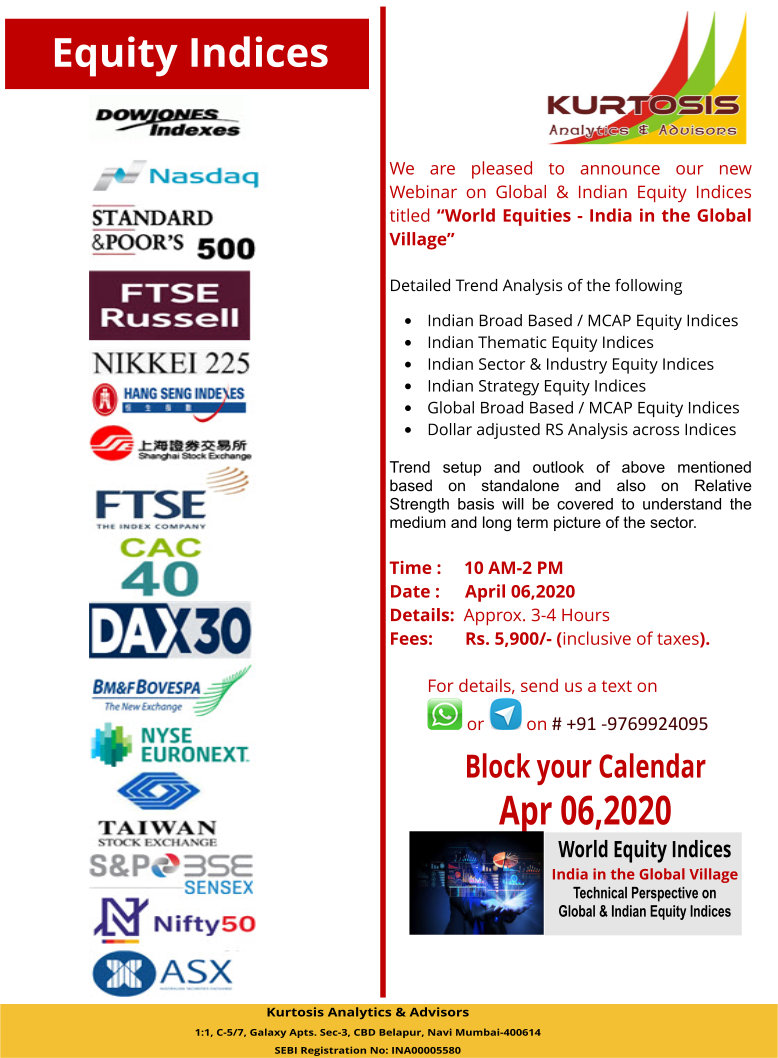
Webinar priced at Rs.5,900/- per participant
Register for the webinar using link below
rzp.io/l/culPktt
Registrations close on Saturday Apr 04, 2020 at 1800 Hours India Time


