Global Financial Markets: Risk off or Risk On : Analyze-Evaluate-Decide-Execute
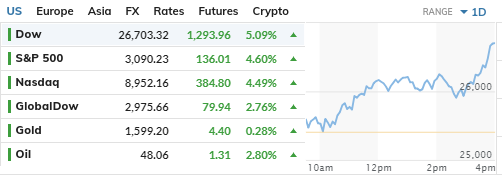
The recent selloff in financial markets globally has raised an important question i.e. is it just the impact of the pandemic #coronavirus or is the something more than what meets the eye?
The recent selloff in financial markets globally has raised an important question i.e. is it just the impact of the pandemic #coronavirus or is the something more than what meets the eye?
Will things come back to track faster than the collapse or is this just the beginning of a painful downward trend in markets worldwide? In simple words, are we in Risk Off or Risk On? Should we look for value buys in decline or should we look to exit longs in counter trend bounce
So today we will present some relative strength charts in front of you and let you decide whether we are in "Risk On" or in "Risk Off"?
The Denominator of all the charts in this thread will be common i.e. US 10YR Treasury Notes which represents the lowest risk asset class.
The Denominator of all the charts in this thread will be common i.e. US 10YR Treasury Notes which represents the lowest risk asset class.
The first chart in the series in S&P 500 versus US10YR Treasury Notes.
The relative strength chart clearly shows that the 38 year trend of out performance by equities over debt is intact & this is just a knee jerk reaction after a prolonged out performance by equities over debt
The relative strength chart clearly shows that the 38 year trend of out performance by equities over debt is intact & this is just a knee jerk reaction after a prolonged out performance by equities over debt

The only concern is the medium term picture where in we observed a test of 11 year long bullish support trend line got tested last week coupled with a trigger of a possible Double Bottom Sell Signal on the weekly chart. If so, then the clearly it indicates that the risks still
remains in the short & medium term which implies that US Equities will continue to remain under pressure and money will flow out towards low risk haven like US10YR till the time the riskier assets stabilise.
We will continue to add more such observation in the thread this week.
We will continue to add more such observation in the thread this week.
The next chart in the series is COMEX GOLD versus US10YR Treasury Notes. Gold being the perceived "safe haven" during "Risk off" & US10YR Treasury Notes being the least risky asset class for investors, makes this ratio interesting for analysis. You'd remember that Comex Gold had
peaked at $1923 in Sep'11 i.e. early part of the previous decade and had corrected to as low as $1045 by Dec'15. So in this chart we compare Gold vs US10YR to ascertain whether there is possibility of Gold out performing US10YR which would imply a "flight to safety" or "Risk Off"
Look at the relative strength chart COMEX GOLD vs US10YR T Notes. Clearly Gold has started out performing again since bottoming out in 2015. More importantly, Gold/UST ratio has recently broken out from "bearish 45° resistance trend line on the longer term charts

This break out implies that all pullbacks in the ratio towards the support zone would be an opportunity to long Gold & even though US10YR T Notes charts does indicate bullish bias when seen on a standalone basis, GOLD would out perform US10YR T Notes.
Such kind of out performance
Such kind of out performance
are typically witnessed in times of panic and distress when public tends to chase low risk assets by totally shunning riskier ones like equities.
We will continue to add more such observation in the thread this week.
We will continue to add more such observation in the thread this week.
The third chart in the series is the Relative Strength between the epitome of consumption and at times inflation i.e. Brent Crude Oil and US10YR T Notes.
Its a chart that reflects the relationship between inflation versus risk free rate of return.
Remember Crude peaked in 2008 at
Its a chart that reflects the relationship between inflation versus risk free rate of return.
Remember Crude peaked in 2008 at
around $150 per barrel to crash to $36 in Dec'08. Liquidity push by central bankers globally helped commodities prices to recover good ground and as a result Crude Prices went back to $128 by Mar'12 as world started to stare at economic crisis in Europe led by Greece & Spain.
Then followed a period of distribution between Mar'12 peak of $128 and Jun'12 low of $88 as Crude prices went trading withing the given range which was clearly a triangular congestion that got completed in Jun'14 when Crude prices eventually broke down as Central Banks started
to unwind the quantitative easing and fiscal stimulus world wide although US10YR Bond Yields continued to slide downwards. Finally a bottom was found at $27 in Jan'16. Even US10YR Bond Yields found some semblance of a bottom at 1.37 six months later in Jul'16. As central banks
started to hike interest rates, both Crude and US10 Bond Yields went up from their lows of Jan'16-Jul'16 respectively and by Oct'18 Crude went to test $87-88 per barrel. Here is where we shift to the relative strength charts for better understanding and perspective building
Clearly the relative strength charts of Brent Crude vs US10YR T Notes indicates a major break down from the 22 year support trend line (see chart) as well as a second attempt successful breakdown from a 45° bullish support trend line and both happening in this year itself.

Falling of Brent Crude clearly means demand destruction now after have traded above $50-60 for major part of past 15 years. Will the support of $27 in Brent formed in Jan'16 hold and follow up with a bounce. We would say, odds are diminishing fast. The under performance would
be glaring given that return of financial stimulus by central banks on the back of #coronavirus on the back of global equity markets capitulation is leading to flight to safety among investors towards US10 T Notes and falling crude is only making the under performance worse
Going forward, once the threat of #coronavirus subsides & gradually goes away, the scars would be revealed & consumption would have taken hit that would need lot of time & money to be brought back to pre-2015 levels.
The next observation is between small caps & US10YR T Notes.
The next observation is between small caps & US10YR T Notes.
The next chart in the series in BSE 200 DOLLEX Index vs US10YR T Notes.
This helps understanding FII flows in & out of an emerging market like India. I've been tracking this for a pretty long time & have found it to be handy especially around the time of a major trend reversal.
This helps understanding FII flows in & out of an emerging market like India. I've been tracking this for a pretty long time & have found it to be handy especially around the time of a major trend reversal.
India has always been a favourite destination for investments for FII's and our capital markets have benefited immensely from the dollar inflow year after year that run into billions of dollars.Though we are always happy to receive inflows in our capital inflows from FII's,
the same can't be said about capital outflows, especially when FII's press the panic button to exit like they did in 2000-01 during DotCom Burst or in 2008-09 during the Financial Crisis. FII's predominantly invest in top 200 companies of BSE/NSE as they suit most of their
investment parameters laid down by the investment committee for investment in emerging market equities. EM investment as per FII's are said to be treated as "risky" compared to investment in "Developed Markets" & thus are the first place for redemption during a crisis situation.
Irrespective of the FII's being a Pension Fund, Teachers Fund, University Fund, Police Retirement Fund, Quant Fund, ETF or any other type, investments in emerging markets are classified as "risky" by their respective investment committee teams even though they may be invested
in the top 200 companies in India as per market capitalisation.
The RS chart between BSE200 Dollex vs US10YR T Notes simply represents the relation between the FII Flow both inward as well as outward. When FII bring inflows, BSE200 Dollex outperforms US10YR T Notes
The RS chart between BSE200 Dollex vs US10YR T Notes simply represents the relation between the FII Flow both inward as well as outward. When FII bring inflows, BSE200 Dollex outperforms US10YR T Notes

i.e risk free rate of return for Dollar and when FII's press exit leading to dollar outflow from India, BSE 200 Dollex under performs US10YR T Notes.
Money divested out of Indian Equities invested in US10YR T Notes for short term till an alternative source to invest is found
Money divested out of Indian Equities invested in US10YR T Notes for short term till an alternative source to invest is found
It is also possible that money divested from Indian Equities maybe used for redemption proceeds. This chart can only suggest that FII money is flowing in or out.We observe that the current ratio of the relative strength chart has tested a 11 year long bullish support trend line
for the 3rd time in the past 11 years and are worried about the implications if the same trend line is unable to hold this time. Either Indian Markets would be witnessing severe outflow in the short run followed by a return of capital once everything stabilises over time
which implies a painful sideways move in the top 200 stocks for around at least 12-18 months from this month or in other case this trend line may hold in the short run only to break down a quarter or two later. Either ways, the chart is simply a warning & should be taken as one.
The bigger question is whether are we becoming a dumping ground for FII's when we are out with our shopping bags after a 20% decline for value investing , bargain hunting or bottom fishing. Does the DI's have it in them to counter the brute selling abilities of FII's.
Only TIME will tell.
Stay tuned for our next chart on relative strength.
Stay tuned for our next chart on relative strength.