#Global #ETF (thread): 26 Aug 2021
- 2020 worst perf #sectors making still leading in 2021 $IXG $IXC
- This is helping #oil producing countries with #SaudiArabia & #UAE in top5 #Country ETF YTD performers in USD $KSA $UAE
- #SouthAfrica $EZA still in top30 YTD performers
- 2020 worst perf #sectors making still leading in 2021 $IXG $IXC
- This is helping #oil producing countries with #SaudiArabia & #UAE in top5 #Country ETF YTD performers in USD $KSA $UAE
- #SouthAfrica $EZA still in top30 YTD performers


2/12
#EmergingMarkets #ETF seriously lagging #DevelopedMarkets ETF, mostly due to disinvestment from #China.
#SouthAfrica might need a lot of catch up, but $EZA YTD performance in USD (+8.2%) is still ahead of $EEM (-0.95%)
#EmergingMarkets #ETF seriously lagging #DevelopedMarkets ETF, mostly due to disinvestment from #China.
#SouthAfrica might need a lot of catch up, but $EZA YTD performance in USD (+8.2%) is still ahead of $EEM (-0.95%)


3/12
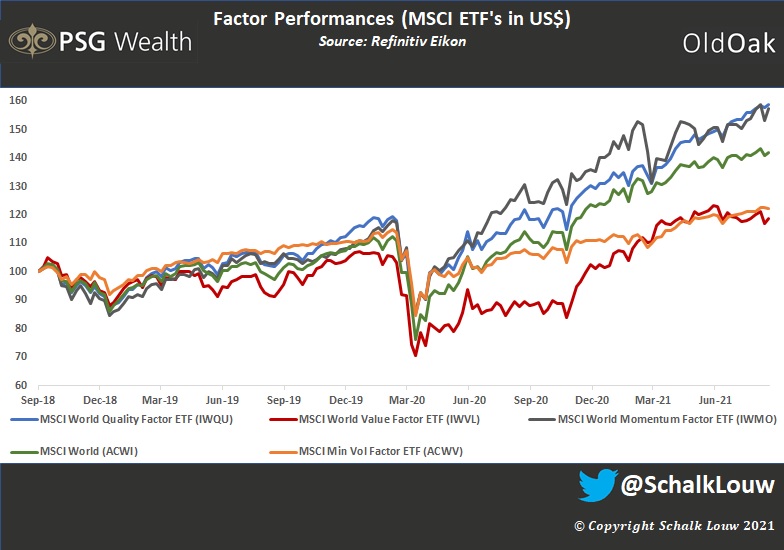
#Global #Value #stocks enjoyed short-term recovery to the end of April, but since then, $IWVL #ETF really struggled against #Quality & #Momentum. Over 1yr period it is however still the best-performing #factor, very much in its recovery phase.
#Global #Value #stocks enjoyed short-term recovery to the end of April, but since then, $IWVL #ETF really struggled against #Quality & #Momentum. Over 1yr period it is however still the best-performing #factor, very much in its recovery phase.

4/12
This still remains one of my biggest concerns, but then again, it's been for some time. #Global #Tech #stocks relative to #MSCI All Country World Index is now approaching Mars. Be very careful.
$IXN vs $ACWI
This still remains one of my biggest concerns, but then again, it's been for some time. #Global #Tech #stocks relative to #MSCI All Country World Index is now approaching Mars. Be very careful.
$IXN vs $ACWI


5/12
#Internet companies still big driver on performance, with US Internet Co's $FDN #ETF growing 8.4% over past 3 months in USD versus +5.2% for #MSCI World $URTH
#Chinese Internet Co's $KWEB however lost 31% over same period. Wow! Not good for #Naspers/#Prosus & also SA $EZA
#Internet companies still big driver on performance, with US Internet Co's $FDN #ETF growing 8.4% over past 3 months in USD versus +5.2% for #MSCI World $URTH
#Chinese Internet Co's $KWEB however lost 31% over same period. Wow! Not good for #Naspers/#Prosus & also SA $EZA


6/12
Speaking of #Chinese co's. China Large-Cap $FXI #ETF massively underperformed #MSCI #EmergingMarkets $EEM ETF, as well as MSCI #SouthAfrica $EZA.
South Africa now caught up to China in USD over a 3 year period.
Speaking of #Chinese co's. China Large-Cap $FXI #ETF massively underperformed #MSCI #EmergingMarkets $EEM ETF, as well as MSCI #SouthAfrica $EZA.
South Africa now caught up to China in USD over a 3 year period.


7/12
#US #Bonds had a slight recovery since March, but #Equities were clearly the star of the show. Be careful over the short term as $TLT #ETF relative to $SPY indicate overbought (equities) & could soon see some profit-taking.
#US #Bonds had a slight recovery since March, but #Equities were clearly the star of the show. Be careful over the short term as $TLT #ETF relative to $SPY indicate overbought (equities) & could soon see some profit-taking.


8/12
$NASDAQ looks even crazier ☝️. Yes, $QQQ just came out of a great reporting season, but be very careful.
$NASDAQ looks even crazier ☝️. Yes, $QQQ just came out of a great reporting season, but be very careful.


9/12
#Gold is not only lagging its "little brother" #Silver over the short-term but also #MSCI #Global #Equities. We are now back at mid-2019's relative levels, which saw Gold enjoyed some serious outperformance back then. This time might be different...
$GLD versus $ACWI
#Gold is not only lagging its "little brother" #Silver over the short-term but also #MSCI #Global #Equities. We are now back at mid-2019's relative levels, which saw Gold enjoyed some serious outperformance back then. This time might be different...
$GLD versus $ACWI


10/12
#Global #Financials #ETF, taking a bit of a breather lately, relative to #MSCI All Country World Index. Still, however, just like other #Value stocks, very much in a recovery phase. IMHO, it's still an opportunity.
$IXG vs $ACWI
#Global #Financials #ETF, taking a bit of a breather lately, relative to #MSCI All Country World Index. Still, however, just like other #Value stocks, very much in a recovery phase. IMHO, it's still an opportunity.
$IXG vs $ACWI


11/12
Speaking about #Financials. #Global #Banks specifically looking quite interesting relative to #MSCI All Country World Index.
$BNKS vs $ACWI
Speaking about #Financials. #Global #Banks specifically looking quite interesting relative to #MSCI All Country World Index.
$BNKS vs $ACWI


12/12
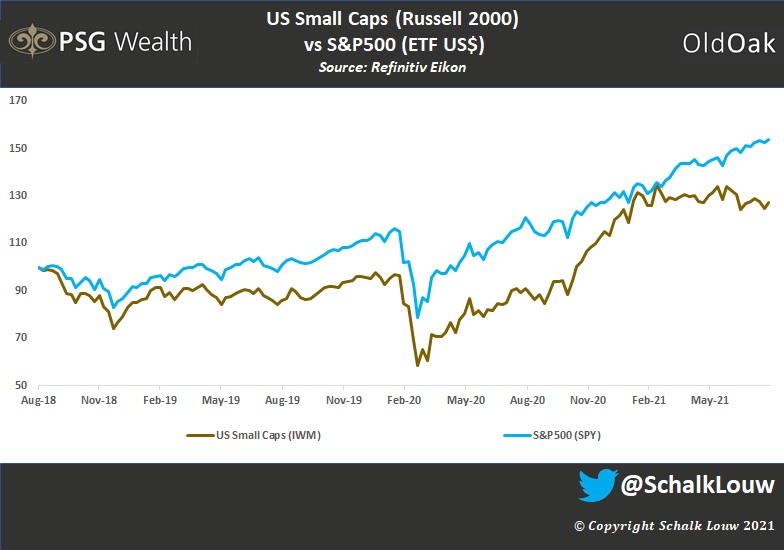
And then finally, what would market feedback be without #smallcaps? After seriously outperforming between Q4 2020 & Q1 2021, the #Russell2000 really struggled since. Not yet a screaming relative oversold against S&P500, but getting close!
$IWM vs $SPY
And then finally, what would market feedback be without #smallcaps? After seriously outperforming between Q4 2020 & Q1 2021, the #Russell2000 really struggled since. Not yet a screaming relative oversold against S&P500, but getting close!
$IWM vs $SPY

Unroll @threadreaderapp
• • •
Missing some Tweet in this thread? You can try to
force a refresh