We’ve had a lot of questions concerning the recent ground motion animations and the locations of our seismic instruments. The instruments shown in this awesome animation are from a special project called USArray. (usarray.org) THREAD
USArray is part of the @EarthScopeInfo project (earthscope.org), an @NSF funded project to study the structure and evolution of the North American continent. 
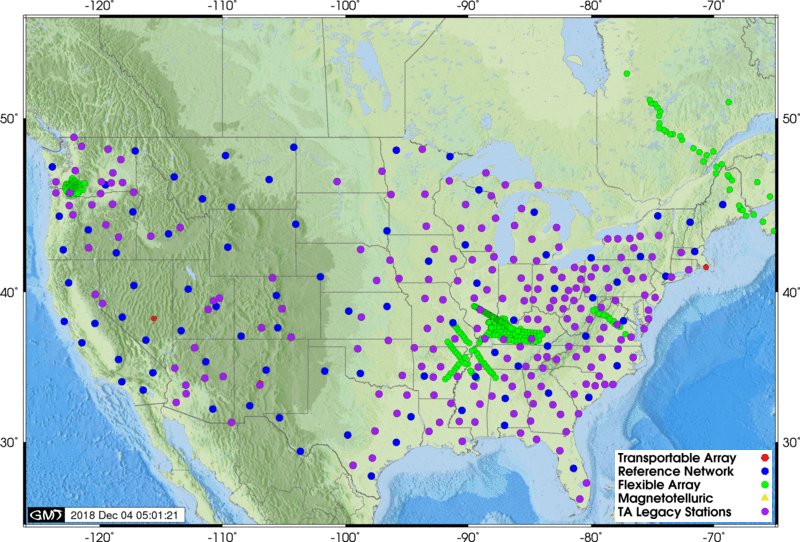
USArray consists of 4 observatories: the Transportable Array (TA), the Flexible Array (FA), the reference network and the Magnetotelluric Array (MA). You can read about all of these in more detail at usarray.org. We’re going to focus on the TA.
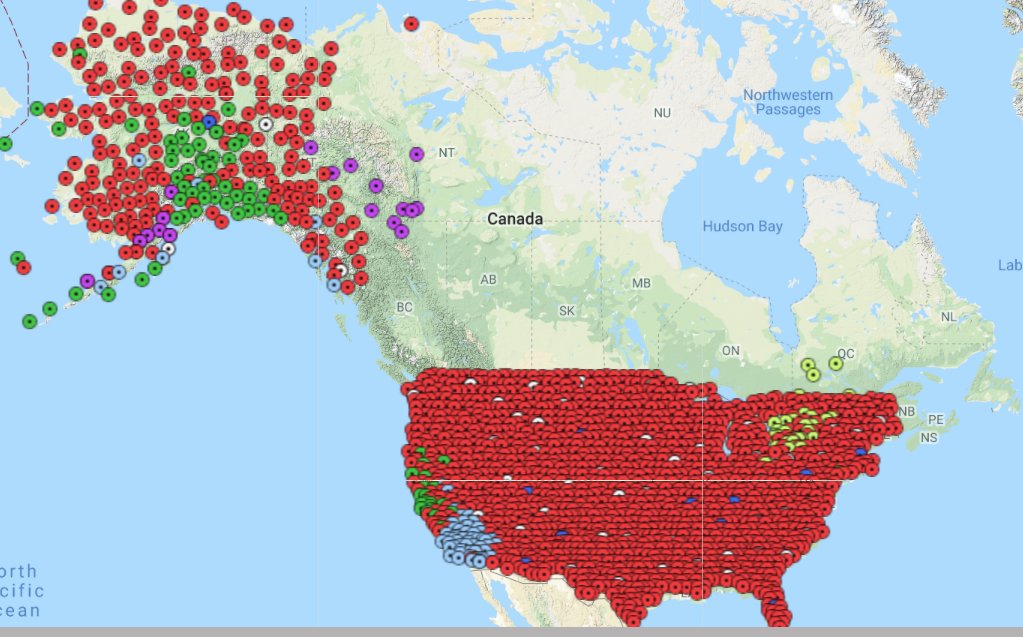
The TA stations are what you see in the ground motion visualizations. The TA is a network of 400 high-quality broadband seismographs & atmospheric sensors that have been operated at temporary sites across the conterminous US from west to east in a regular grid pattern.
With station spacing of about 70 km, TA data are useful for detecting small eqs & mapping the structure of Earth’s interior beneath North America. After a residence time of 2 years, each instrument was picked up & moved to the next location on the eastern edge of the array.

When completed, nearly 2000 locations will have been occupied during this program. Here's a station list ds.iris.edu/ds/nodes/dmc/e…
Some stations were "adopted" and some were left behind to continue monitoring. These stations join the reference network as permanent seismic stations
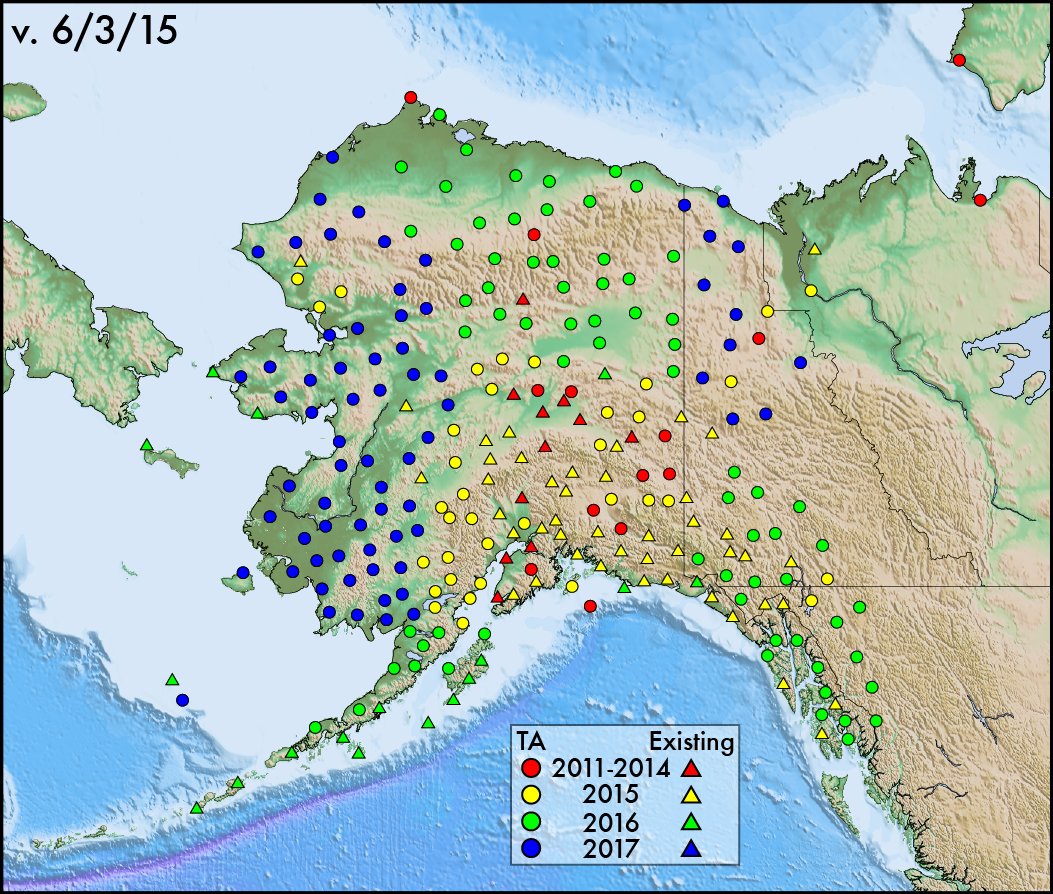
In August 2007, the first footprint was established from north to south along the westernmost quarter of the United States. The TA finished its eastward migration in fall 2013, and is currently deployed in #Alaska. usarray.org/alaska
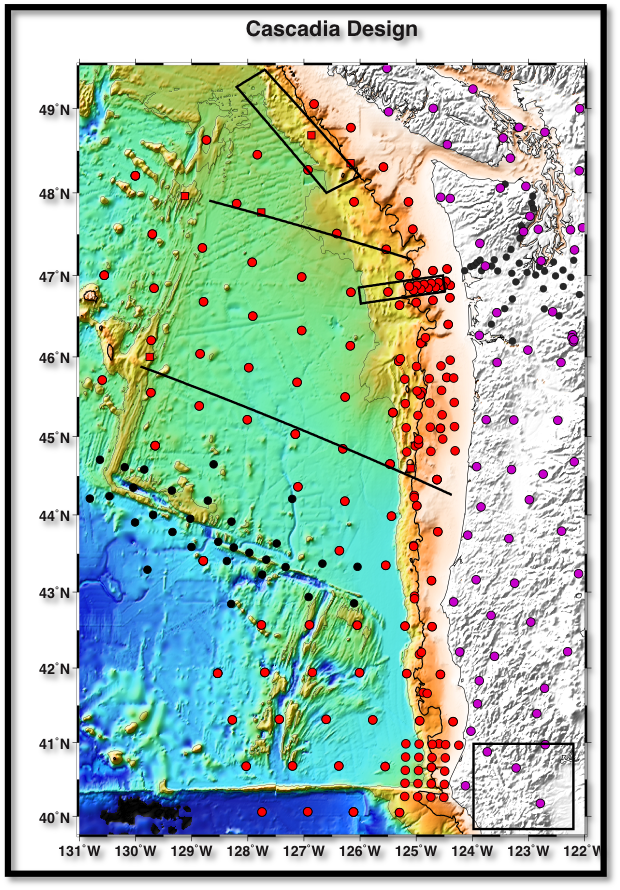
As part of the Cascadia Initiative, 27 additional TA stations were also redeployed to the Pacific Northwest. usarray.org/researchers/ob…
Each of the Transportable Array stations consists of a three-component broadband seismometer with associated signal processing, power, and communications equipment. Here's an older broadband, retired from the Global Seismographic Network.

Data from each station are continuously transmitted to the Array Network Facility (anf.ucsd.edu) where operational and quality checks are performed and then sent to the IRIS Data Management Center (ds.iris.edu/ds/nodes/dmc/) where the data & metadata are archived.
The TA is not the only seismic network and its sensors are not the only sensors. The Global Seismographic Network has sensors in the US, Canada and across the world. iris.edu/hq/programs/gsn. Other countries have their own seismic networks.
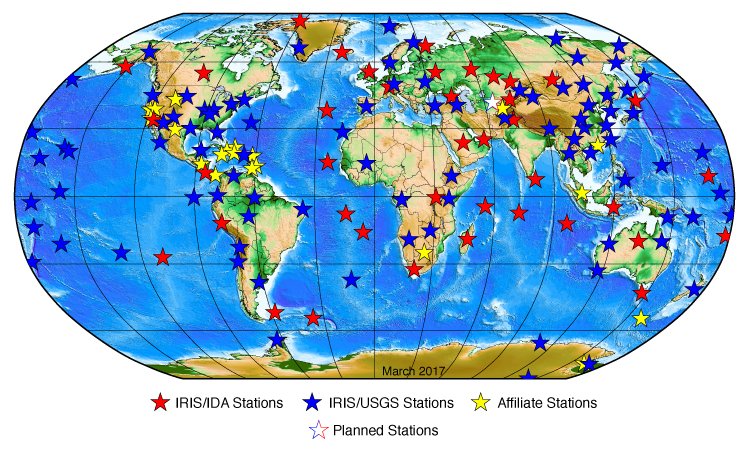
Here is a list of many of the seismic networks world-wide fdsn.org/networks/ The are A LOT.
There is also a large cache of instruments used for special and regional projects (handled by PASSCAL - passcal.nmt.edu) called the Flexible Array. usarray.org/researchers/ob…
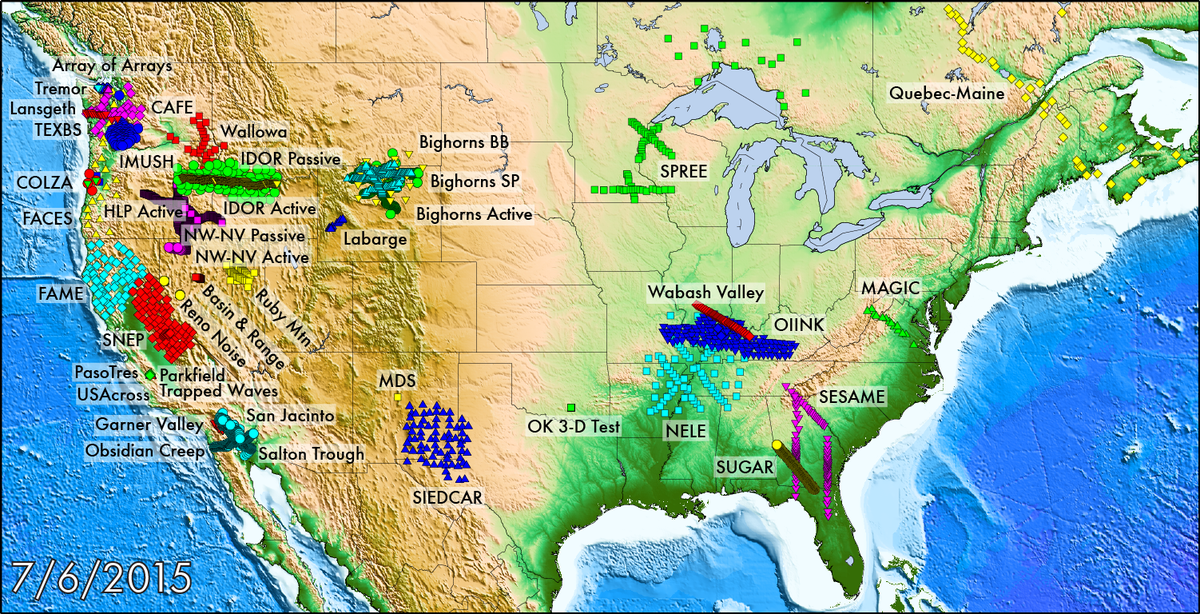
Many important topics are investigated with the Flexible Array, including the depth of faults, magma chamber dimensions beneath active volcanoes, the relation between crustal tectonics & mantle structure & the structure and magmatic plumbing of continental rifts.
So, just because a ground motion vis doesn't show a seismic station near you doesn't mean there isn't one. Do you have a seismic station near you? Probably! You can check here - iris.edu/app/station_mo…
Why do we only use TA stations for ground motion visualizations? Because instruments from other seismic networks have different settings and different calibrations which makes it difficult to include them in the animation, which is strictly educational.
Do the seismic waves skip Canada, or skip other areas where there are no sensors? No. It’s just that you can’t “see” waves because we either don’t have sensors in that location or aren’t using the sensors in those locations.
The number and density of seismic instruments in the US right now is unusual, and is a result of the EarthScope project. A big thank you to @NSF for funding this amazing project that has helped us to examine the earth in unprecedented resolution!

@threadreaderapp unroll