
Today I'd like to talk about jet streams, atmospheric turbulence, and climate change.
Why do we even have jet streams? At any fixed altitude, the north-south temperature difference between equator and pole causes the eastward wind to increase with height (wind shear).
Why do we even have jet streams? At any fixed altitude, the north-south temperature difference between equator and pole causes the eastward wind to increase with height (wind shear).

You can check out the current positions and speeds of the jet streams interactively at earth.nullschool.net. (Change height to 250 hPa to move up to the altitudes where they typically blow the fastest.)
Jet streams move around from one day to the next and vary in strength. They play a crucial role in steering weather systems as well as aircraft (which enjoy the tailwinds on eastbound flights, but try to avoid the westbound headwinds).
But the jet streams also contain lots more invisible (clear-air) turbulence than the rest of the atmosphere, because the strong shear in the jet streams leads to instabilities, as demonstrated in the beautiful laboratory experiment in this video.
Unfortunately, we have good observational and theoretical evidence that climate change is increasing the strength of the shear in the jet streams, and this is causing aircraft turbulence to become stronger and more frequent, i.e. bumpier flights and an increased risk of injuries.
Our published projections indicate several hundred per cent more turbulence in the coming decades, on some of the world's busiest flight routes, as the jet streams respond to climate change. Here are some of our projections for different regions...
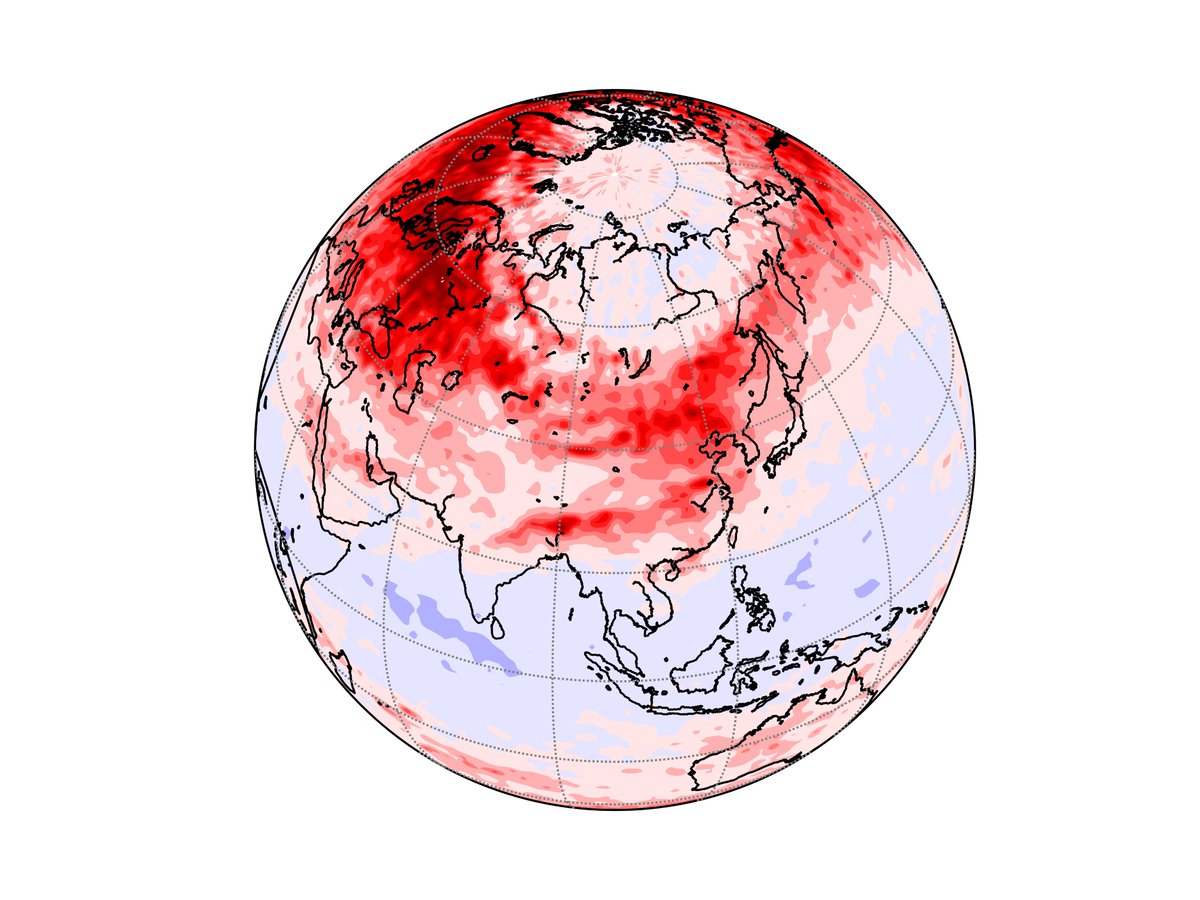
Climate change is projected to cause much bumpier flights across Asia in the coming decades.
In this image, red indicates up to 500% more turbulence, and blue indicates up to 500% less.
Source: dx.doi.org/10.1002/2017GL…
In this image, red indicates up to 500% more turbulence, and blue indicates up to 500% less.
Source: dx.doi.org/10.1002/2017GL…
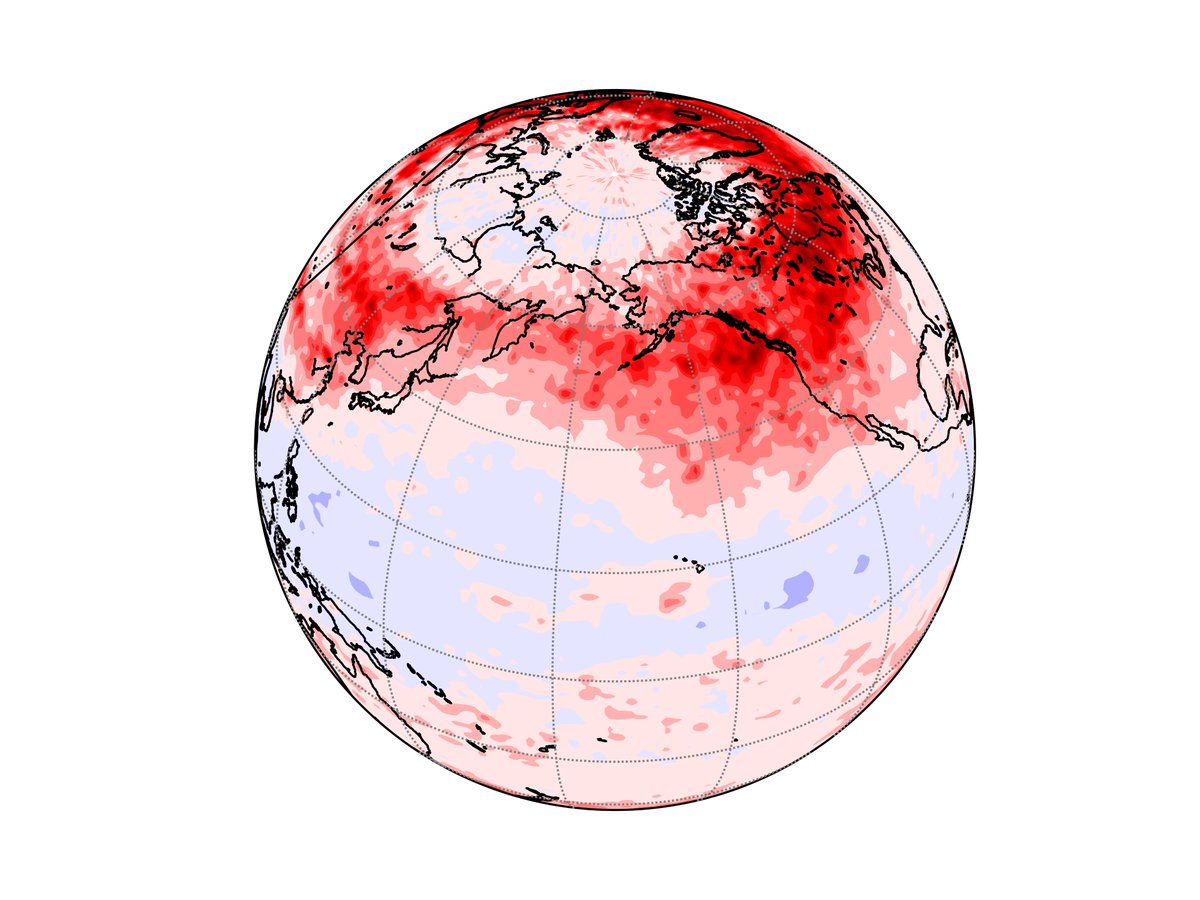
Climate change is projected to cause much bumpier flights across the North Pacific in the coming decades.
In this image, red indicates up to 500% more turbulence, and blue indicates up to 500% less.
agupubs.onlinelibrary.wiley.com/doi/10.1029/20…
In this image, red indicates up to 500% more turbulence, and blue indicates up to 500% less.
agupubs.onlinelibrary.wiley.com/doi/10.1029/20…
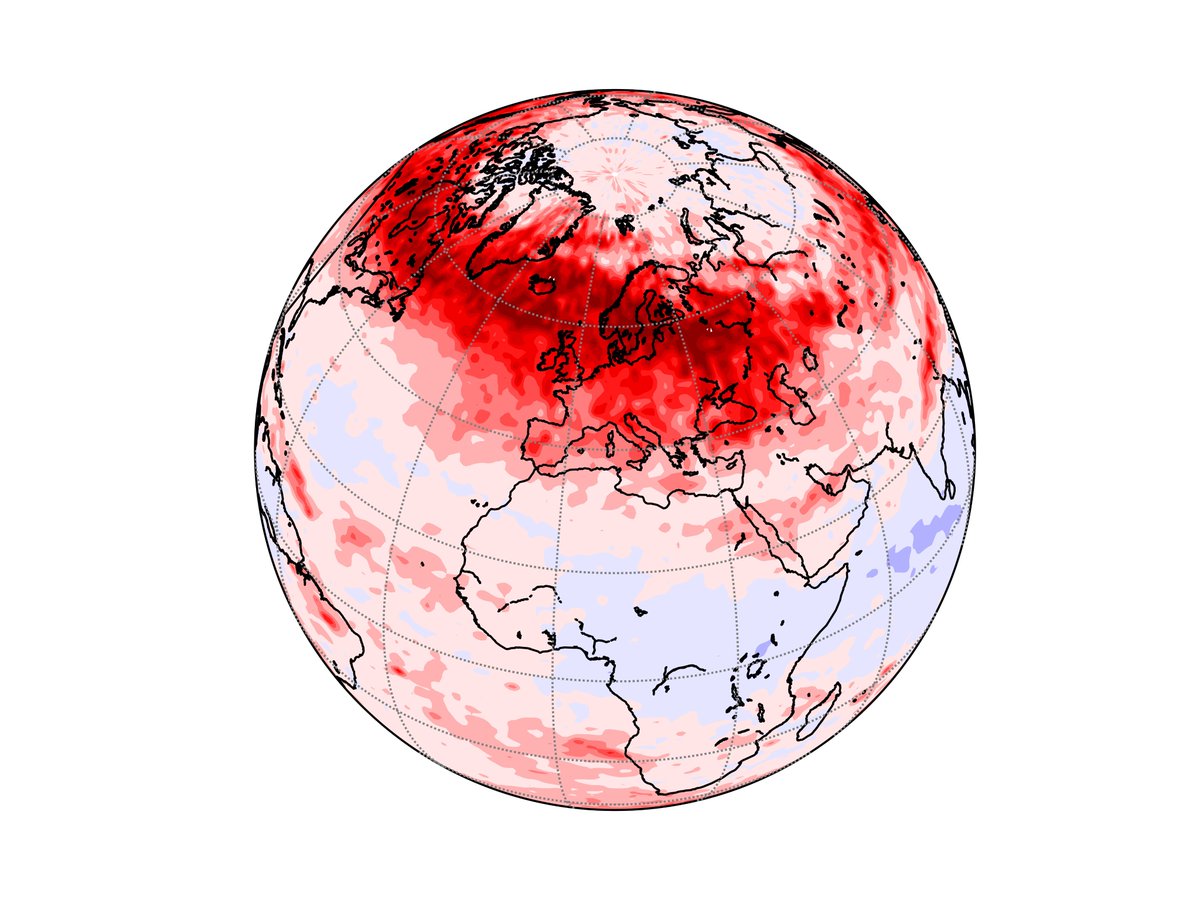
Climate change is projected to cause much bumpier flights across Europe in the coming decades.
In this image, red indicates up to 500% more turbulence, and blue indicates up to 500% less.
Source: agupubs.onlinelibrary.wiley.com/doi/10.1029/20…
In this image, red indicates up to 500% more turbulence, and blue indicates up to 500% less.
Source: agupubs.onlinelibrary.wiley.com/doi/10.1029/20…
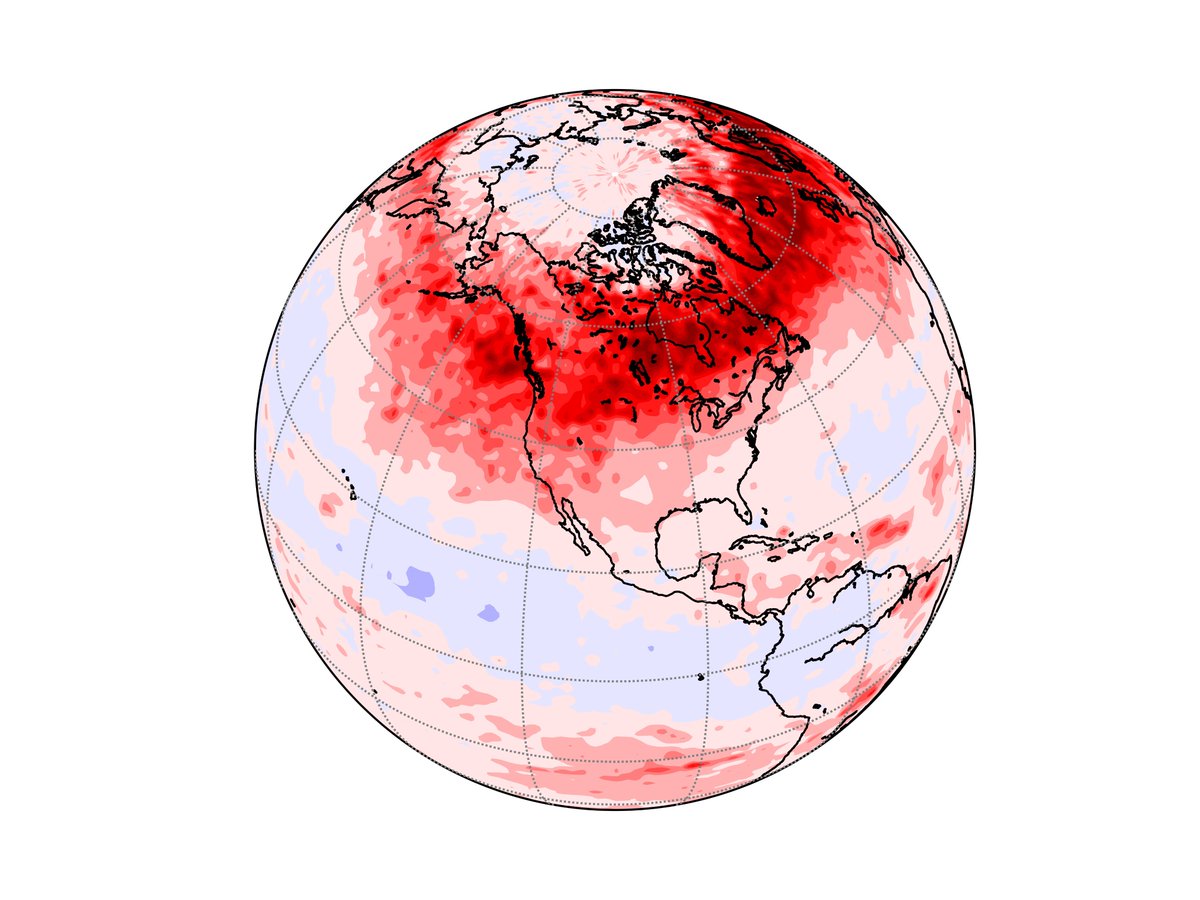
Climate change is projected to cause much bumpier flights across North America in the coming decades.
In this image, red indicates up to 500% more turbulence, and blue indicates up to 500% less.
Source: agupubs.onlinelibrary.wiley.com/doi/10.1029/20…
In this image, red indicates up to 500% more turbulence, and blue indicates up to 500% less.
Source: agupubs.onlinelibrary.wiley.com/doi/10.1029/20…
These turbulence increases from climate change make it even more important that we improve the turbulence forecasts used by the aviation sector to route planes.
Speaking of which: there's a lot of turbulence forecast over the US today. Buckle up!
aviationweather.gov/turbulence/gtg
Speaking of which: there's a lot of turbulence forecast over the US today. Buckle up!
aviationweather.gov/turbulence/gtg
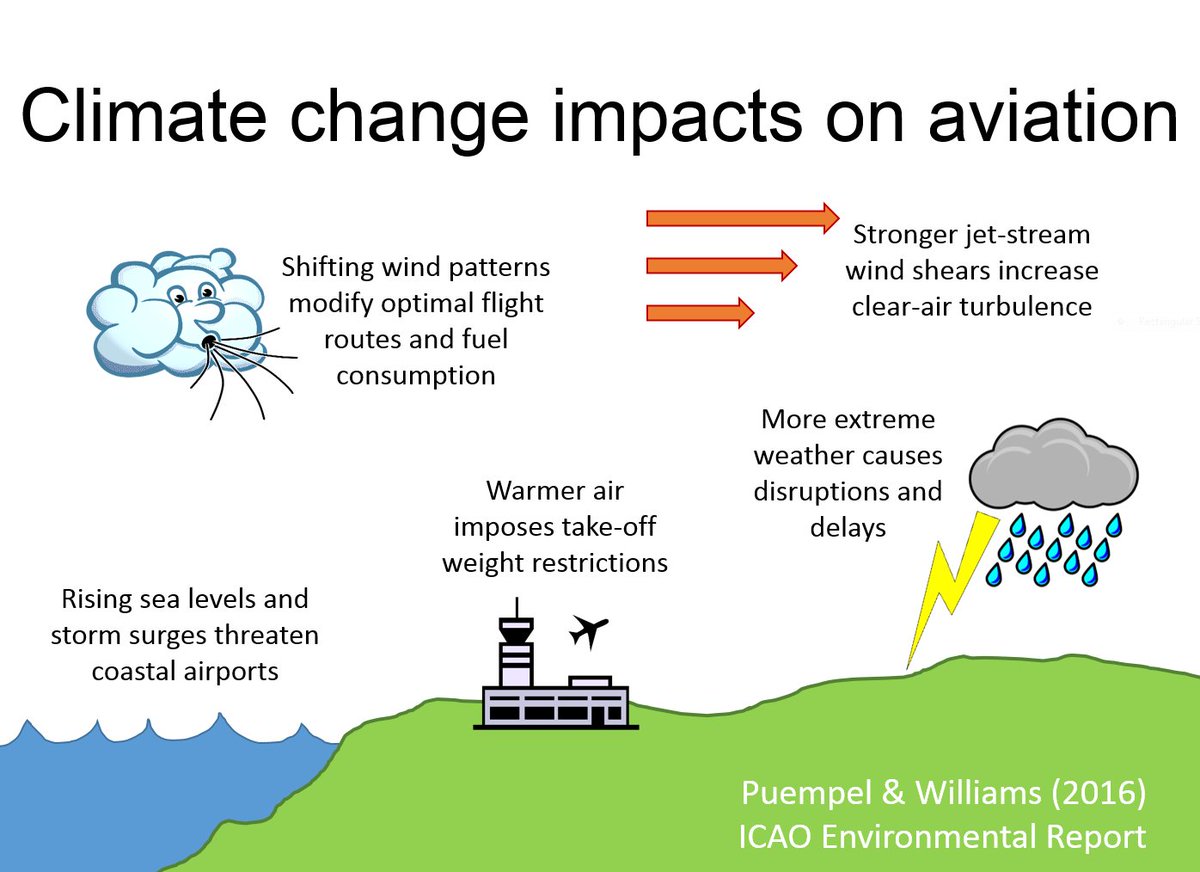
Increased turbulence is only one of many possible impacts of climate change on aviation.
Here's an infographic I put together for the UN aviation agency's environmental report.
Source: icao.int/environmental-…
Here's an infographic I put together for the UN aviation agency's environmental report.
Source: icao.int/environmental-…
I'll close this thread by noting that (very!) strange features sometimes show up in the jet stream :-)


