THREAD
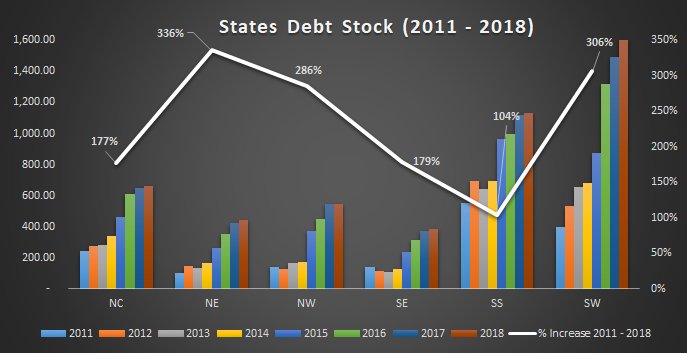
Note that 2018 data is only for H2:2018. But it is sufficient for analysis

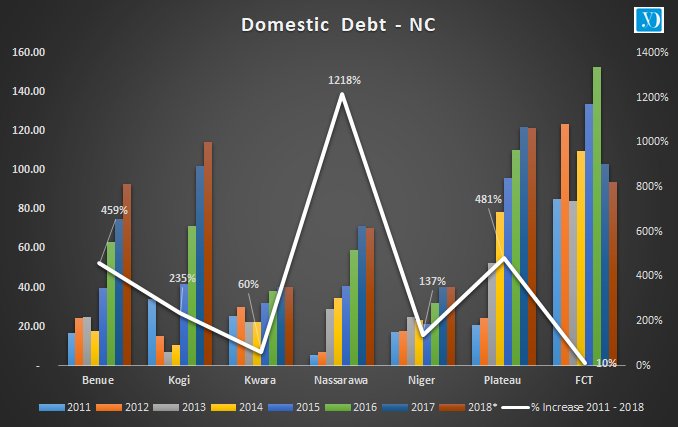
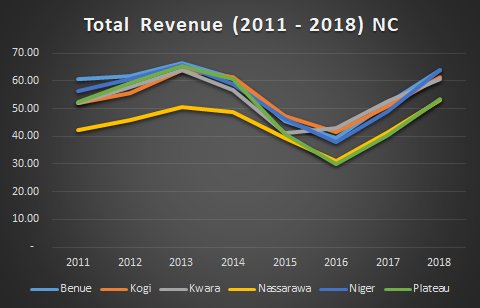
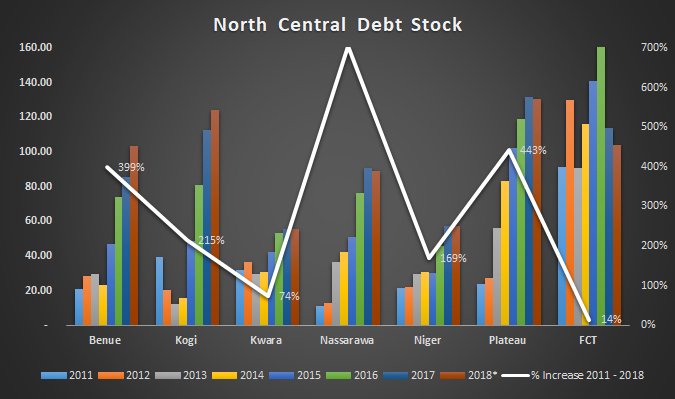
Plateau has the highest debt stock of N130 Billion while Kwara has the lowest with N56 Billion. In terms of percentage increase from 2011 to 2018, Nasarawa has the highest of 704% while FCT has the lowest of 14%. #StateOfStates

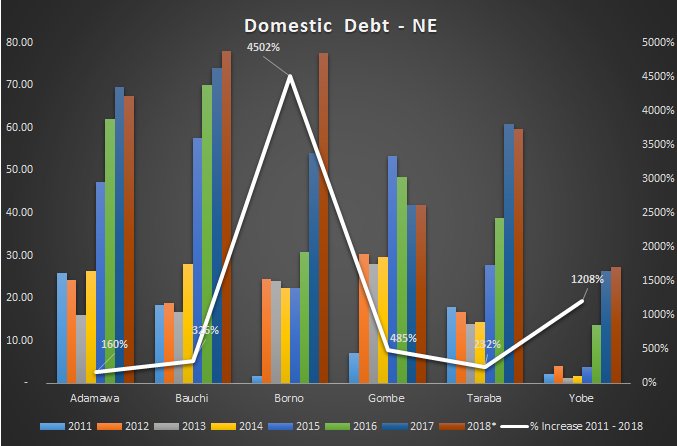
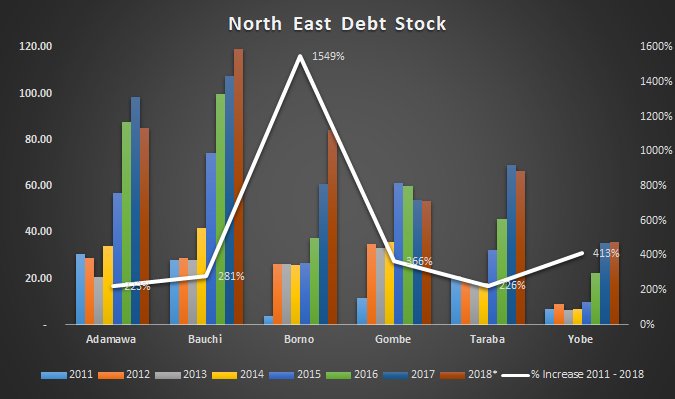
Bauchi has the highest debt stock of N119 Billion while Yobe has the lowest with N36 Billion. In terms of percentage increase from 2011 to 2018, Borno has the highest of 1549% while Adamawa has the lowest of 223%. #StateOfStates

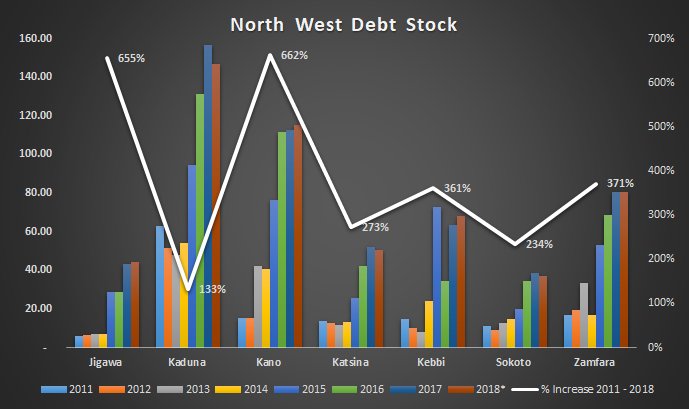
Kaduna has the highest debt stock of N147 Billion while Sokoto has the lowest with N37 Billion. In terms of percentage increase from 2011 to 2018, Kano has the highest of 662% while Kaduna has the lowest of 133%. #StateOfStates

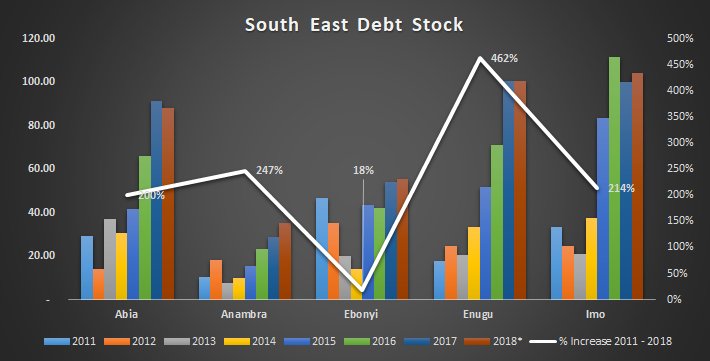
Imo has the highest debt stock of N104 Billion while Anambra has the lowest with N35 Billion. In terms of percentage increase from 2011 to 2018, Enugu has the highest of 462% while Ebonyi has the lowest of 18%. #StateOfStates

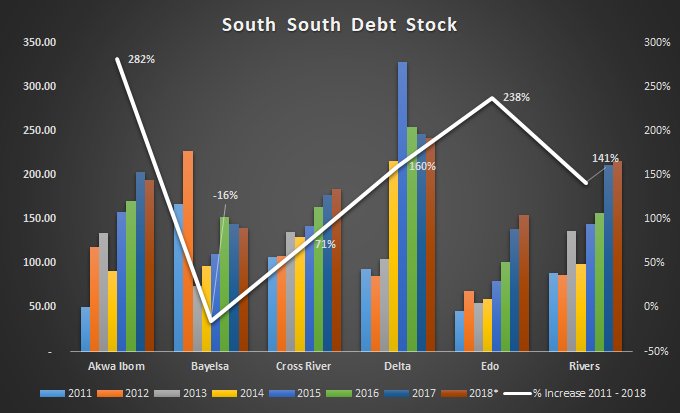
Delta has the highest debt stock of N242 Billion while Bayelsa has the lowest with N140 Billion. In terms of percentage increase from 2011 to 2018, Akwa Ibom has the highest of 282% while Bayelsa has the lowest of -16%. #StateOfStates

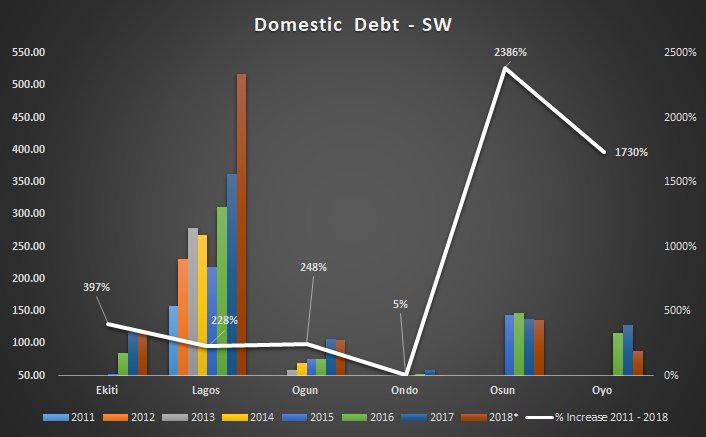
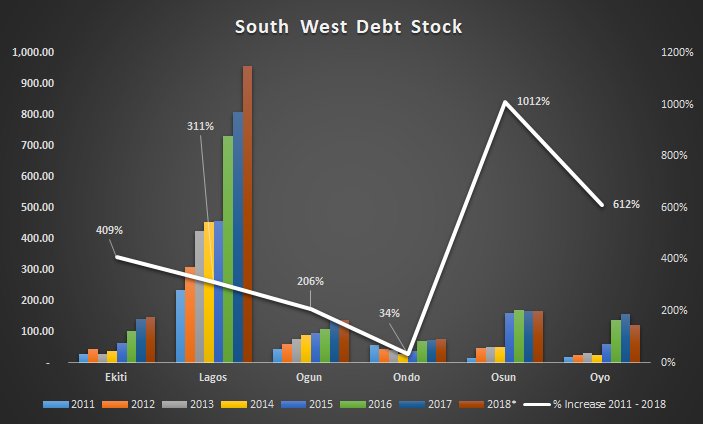
Lagos has the highest debt stock of N960 Billion while Ondo has the lowest with N75 Billion. In terms of percentage increase from 2011 to 2018, Osun has the highest of 1012% while Ondo has the lowest of 34%. #StateOfStates

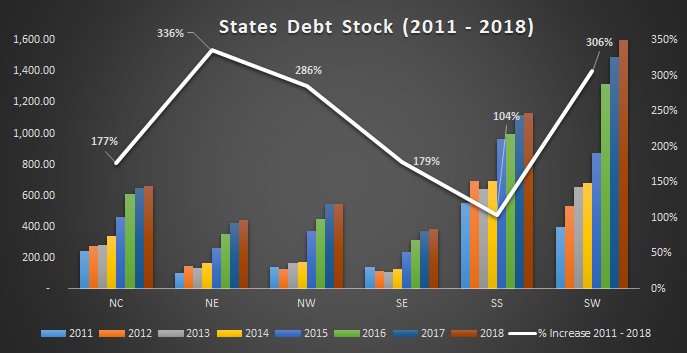
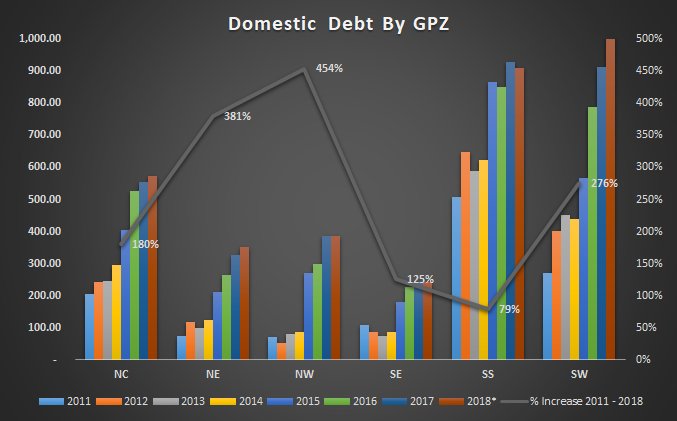
For Domestic Debt by GPZ, the SW has the highest of N1Trillion followed by the SS of N910 Billion. The SE is the lowest with N241Billion. In terms of percentage increase from 2011 - 2018, the NW is the highest (454%) while the SS is the lowest. (79%) #StateOfStates

In terms of debt ranking, these are the top 10 debtors in 2011 and the top 10 in 2018. It is worthy of note that 7 of the top 10 in 2011 are still in the top 10 in 2018 with the exception of Ebonyi, Ondo and the FCT. #StateOfStates
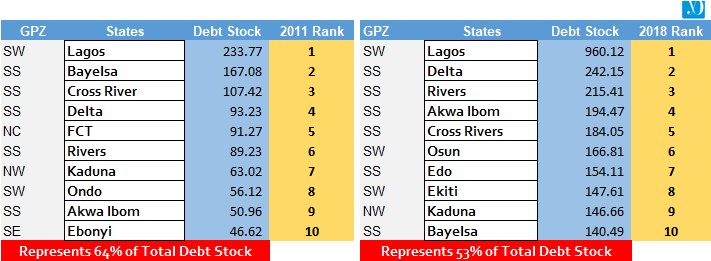
Out of the top 10 in 2011
5 were from the SS
2 were from the SW
1 was from the SE
1 was from the NC
1 was from the NE
*64% of total debt stock
Out of the top 10 in 2018
6 are from the SS
3 are from the SW
1 was from the NW
*53% of total debt stock
#StateOfStates
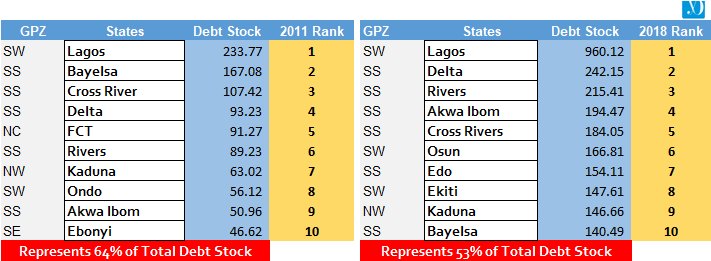
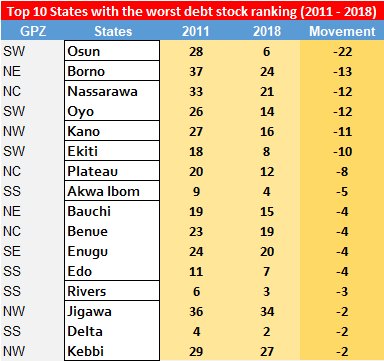
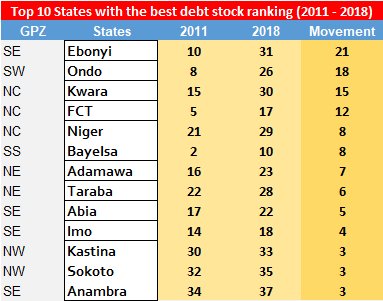
The top 10 States with the worse and best debt ranking measured by movement in ranking between 2011 - 2018 are attached. As you can see, Osun moved 22 places from 24 in 2011 to 6 in 2018 while Ebonyi moved 21 places from 10 in 2011 to 31 in 2018. #StateOfStates
