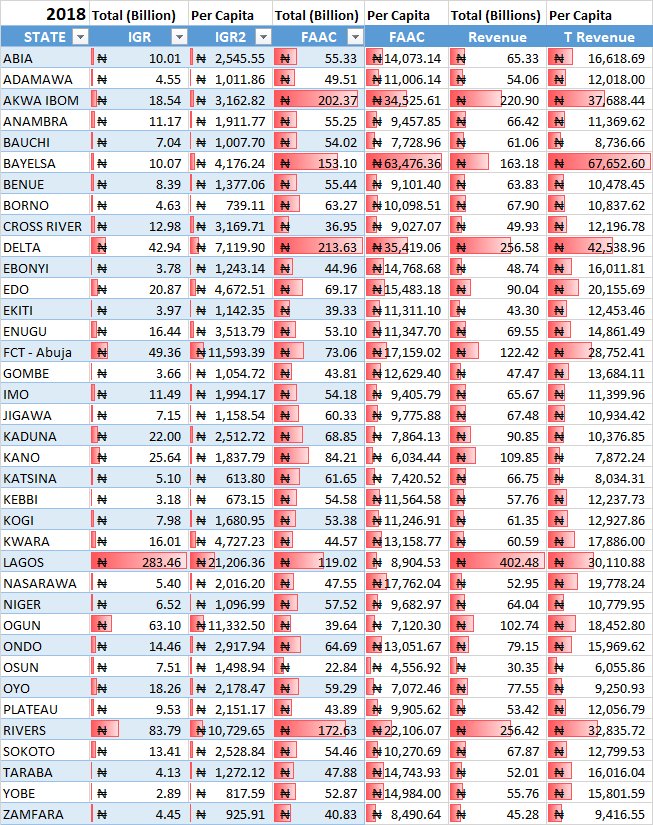
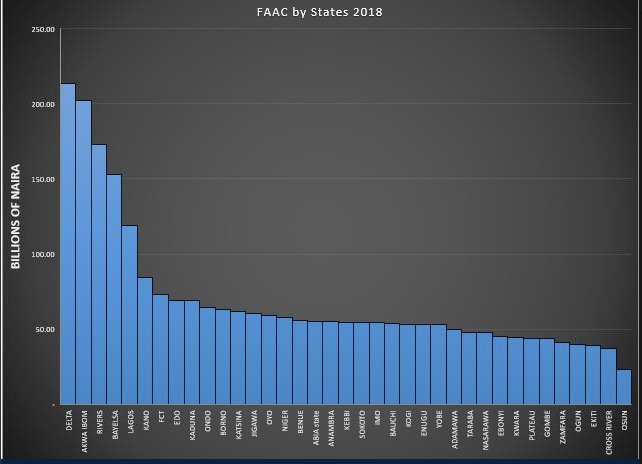
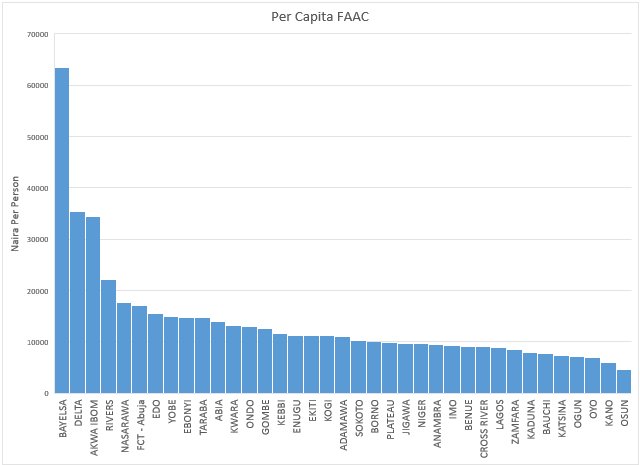
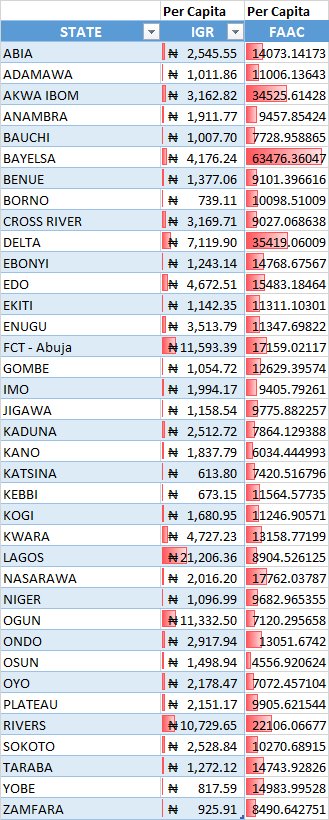
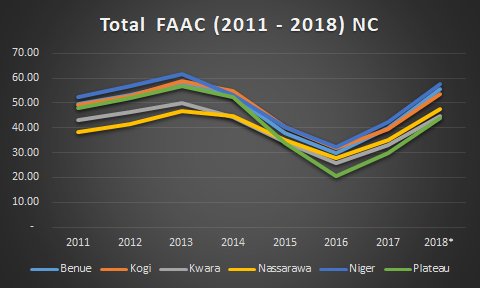
Please note that data for 2018 is missing Q4 (IGR) and Dec (FAAC)
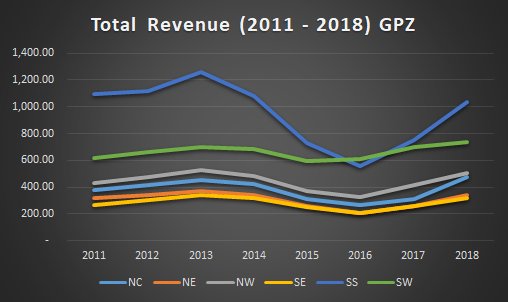
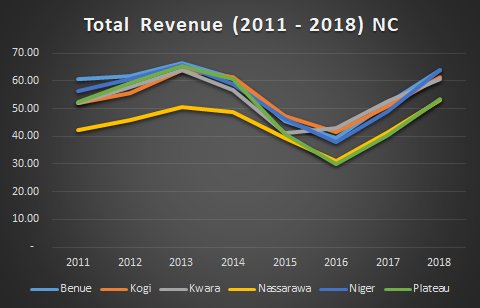
Total revenue (IGR + FAAC) accrued to States from 2011 - 2018 is N24 Trillion (24% - IGR, 76% - FAAC). Out of this amount, SS accounted for 30%, SW, 22%, NW 15%, NC 14%, NE 10% and SE 9%. The trajectory followed the rise and fall of oil prices. #StateOfStates

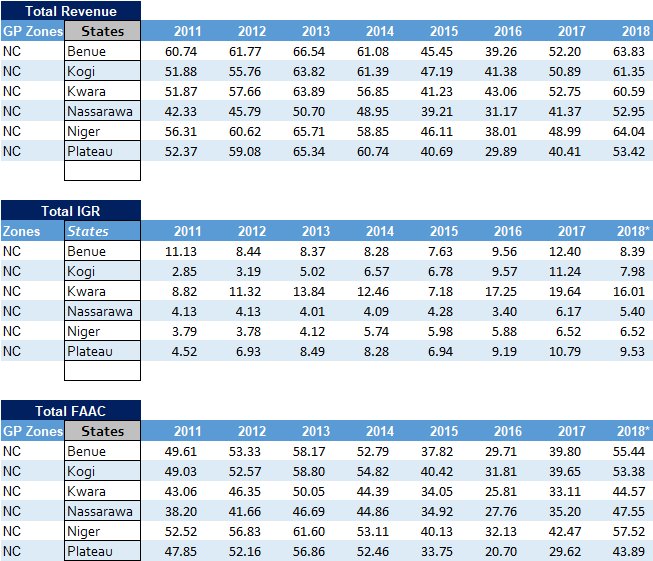
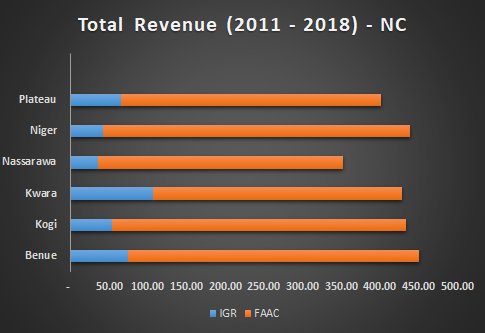
In the NC, while Niger State accounted for the highest revenue in the zone and also the highest in terms of FAAC, Kwara, accounted for the highest IGR. Of note however is that the IGR curve did not follow the same trajectory as FAAC and Total Rev. #StateOfStates
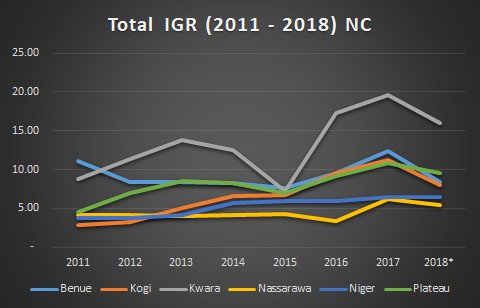
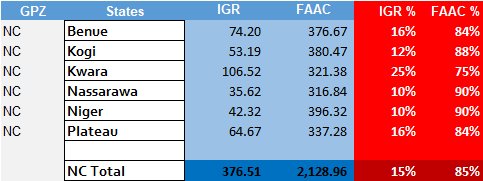
In total, IGR accounted for 15% of total revenue while FAAC accounted for 85% from 2011 - 2018. The highest in the zone in terms of IGR is Kwara at 25% while the lowest is Niger at 10%. In total, the zone accounted for N2.5 Trillion of Total Rev. #StateOfStates
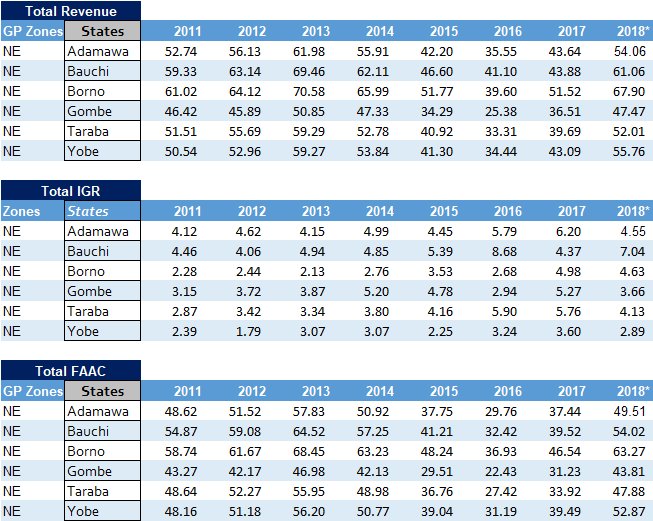
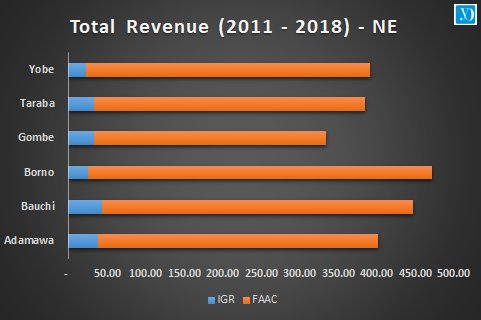
In the NE, while Borno accounted for the highest revenue in the zone and also the highest FAAC. Bauchi, accounted for the highest IGR and Yobe the lowest. You will also notice that the IGR curve didn't follow the same trajectory as FAAC and Total Rev. #StateOfStates
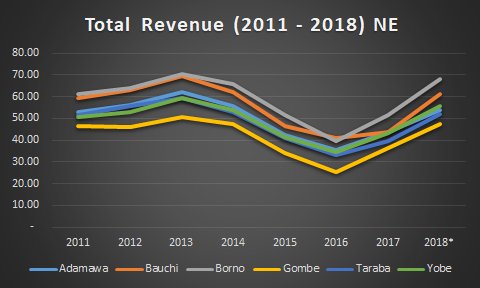
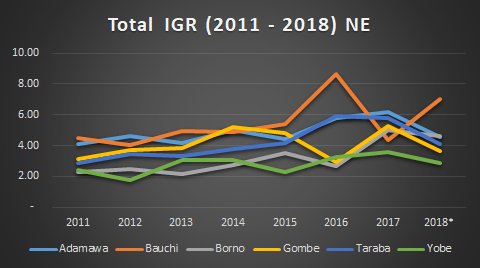
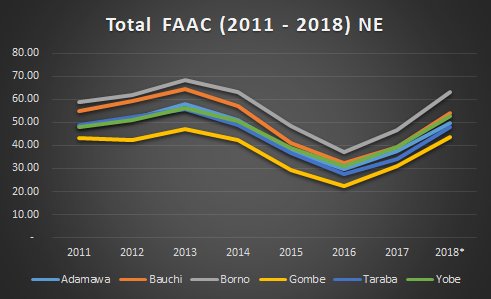
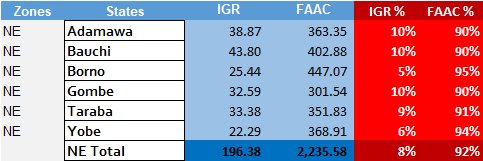
In total, IGR accounted for 9% of total revenue while FAAC accounted for 91% from 2011 - 2018. Adamawa, Bauchi, Gombe and Taraba all seem to have the same distribution of IGR Vs FAAC. The zone accounted for N2.4 Trillion of Total Rev. #StateOfStates
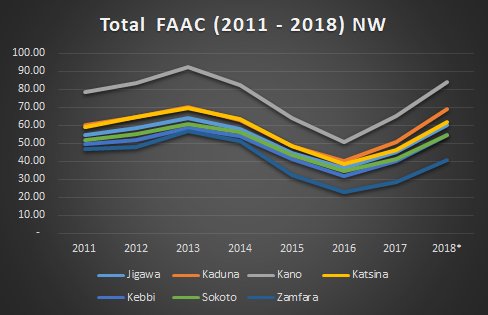
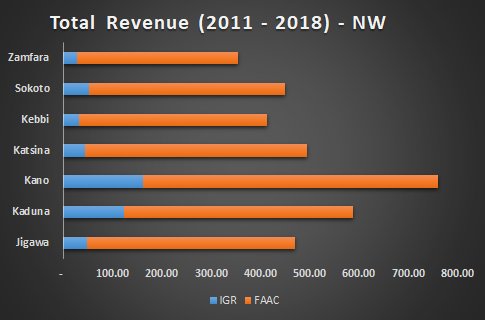
In the NW, Kano is obviously the King here. Accounting for the highest Revenue, IGR and FAAC. Again the IGR curve didn't follow the same trajectory as FAAC and Total Rev. This is telling because it shows the path to sustainability for the States. #StateOfStates
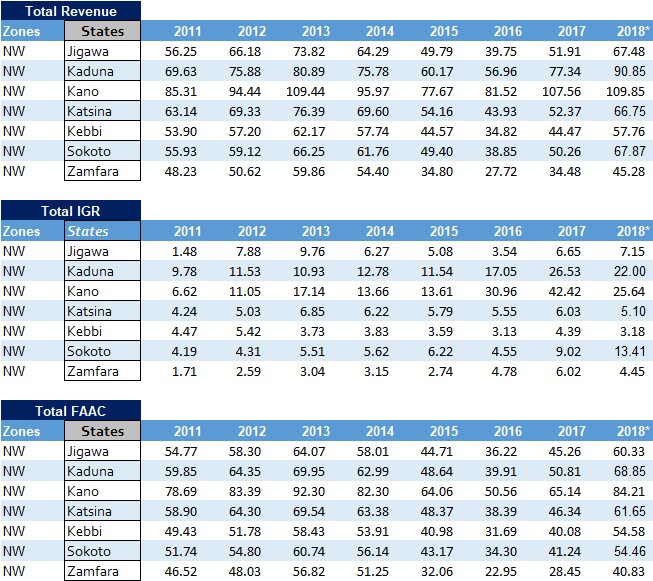
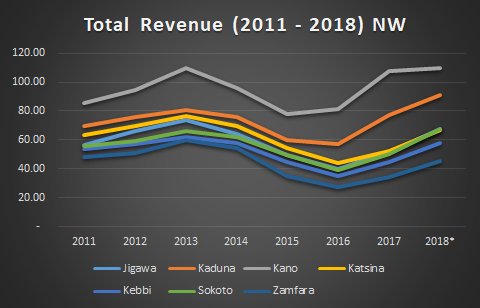
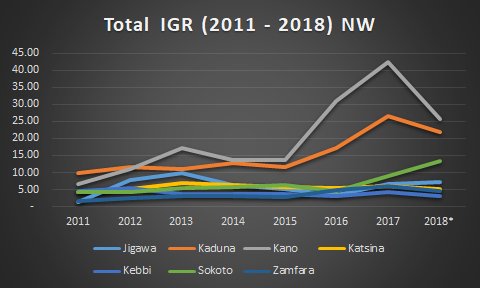
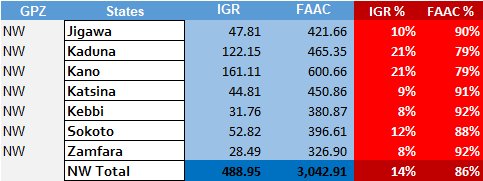
In total, IGR accounted for 14% of total revenue while FAAC accounted for 86%. Both Kano and Kaduna generate 21% of total revenue internally. The others hover around 8% -10%. The zone accounted for N3.5 Trillion of Total Revenue. #StateOfStates
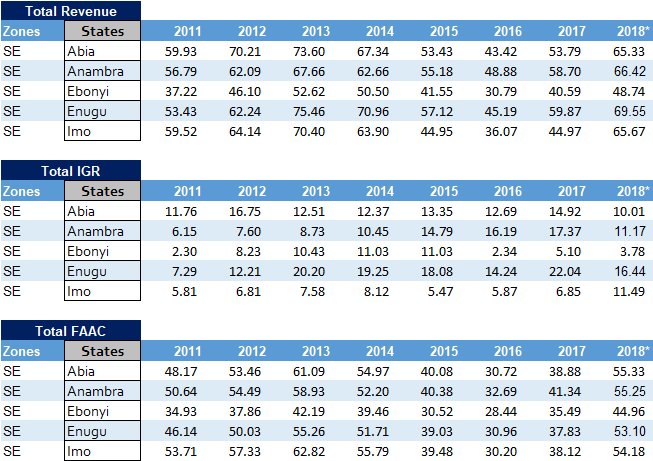
The SE shows a more even position in terms of total revenue. However, in terms of IGR, Enugu accounts for the highest while Ebonyi accounts for the lowest. Again the trajectory of IGR shows that it was not necessarily impacted by the drop in FAAC Rev. #StateOfStates
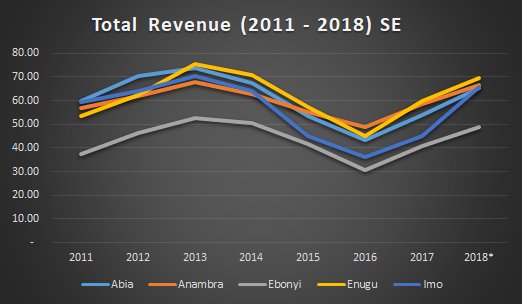
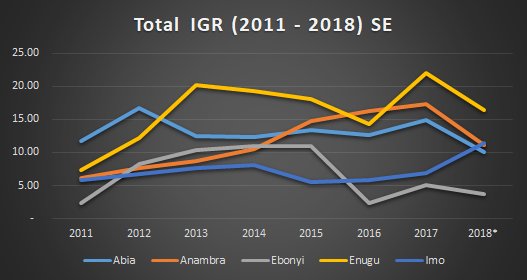
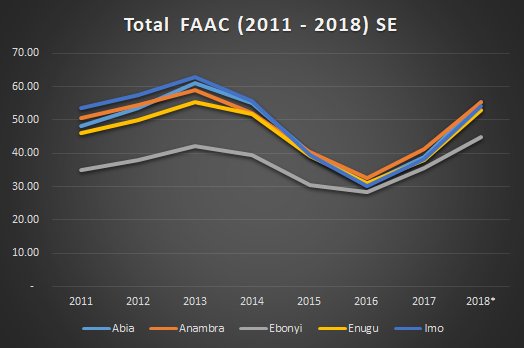
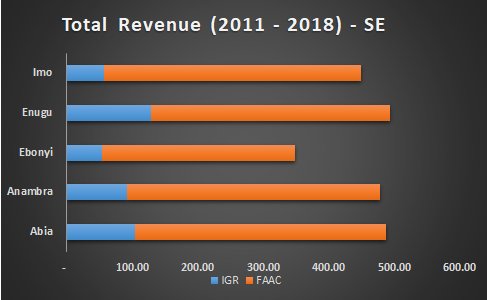
Distribution of revenue shows that IGR contributes 19% while FAAC contributes 81%. Enugu is the only State in the SE that generates IGR greater than 25% of revenue. The Zone accounts for N2.3 Trillion of total revenue from 2011 - 2018. #StateOfStates

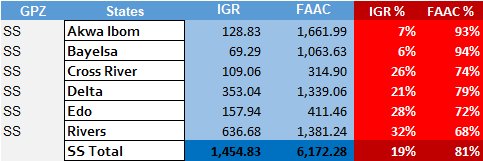
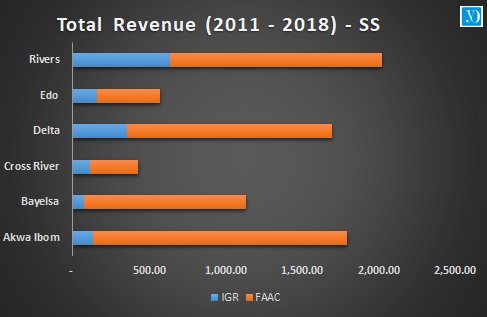
The SS is a show of the have too much and the have none. The Trio of Akwa-Ibom, Delta and River controls over 70% of the income of the region. Rivers State tops the IGR list with 33% of total income. Again, IGR did not follow FAAC revenue curve. #StateOfStates
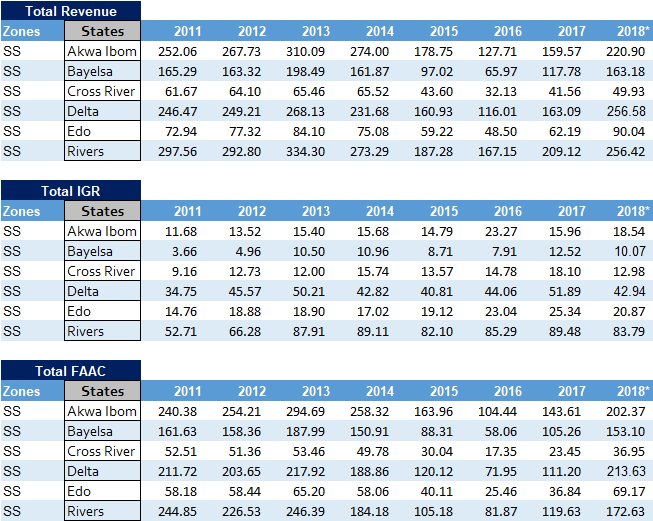
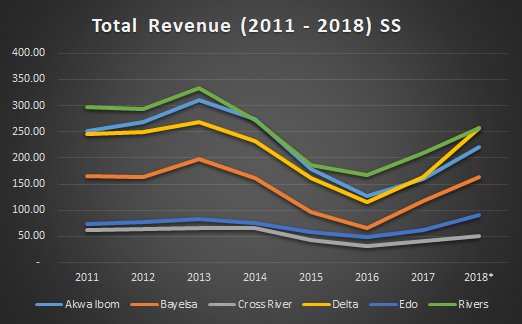
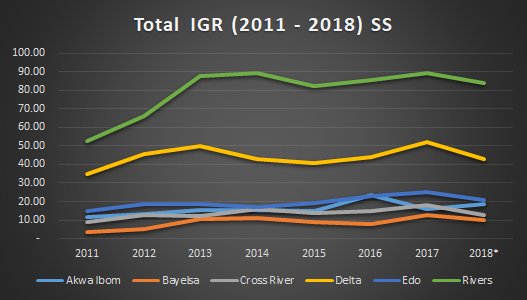
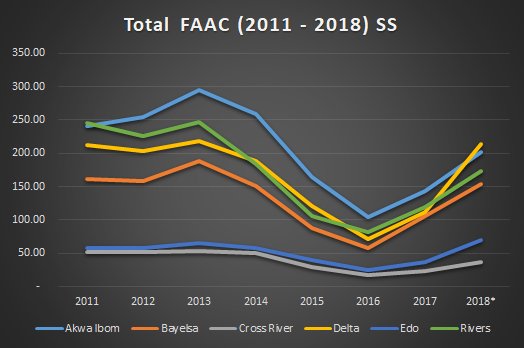
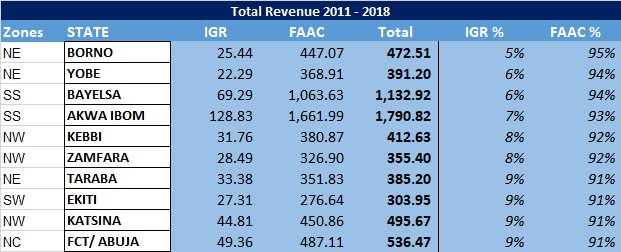
Overall, the picture for the SS is very poor. Total IGR is 19%. A State like Akwa-Ibom for instance generates 7% from IGR while Bayelsa generates 6%. Compare that with Cross Rivers - 26%. In total, they account for N7.6 Trillion of total revenue. #StateOfStates
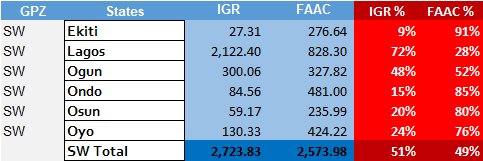
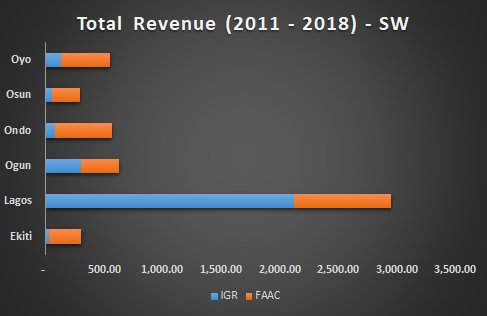
The SW is the only zone that can boast of generating a large part of its revenue from IGR. Thanks to Lagos. However, Ekiti and Osun are lagging behind. The SW is the only region where the trajectory of the total revenue almost matches that of IGR. #StateOfStates
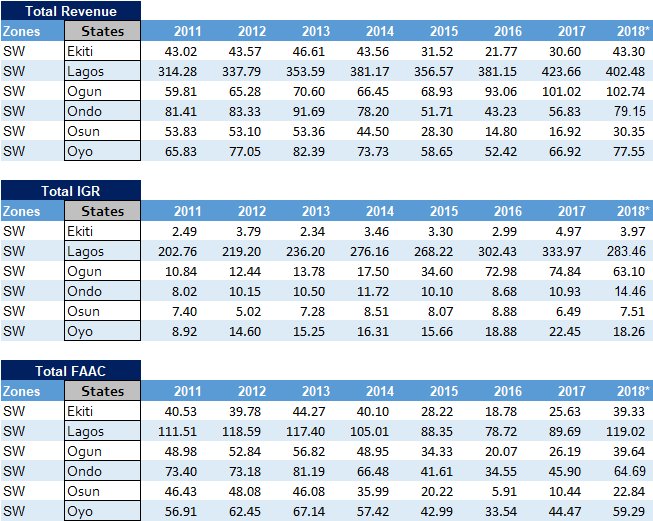
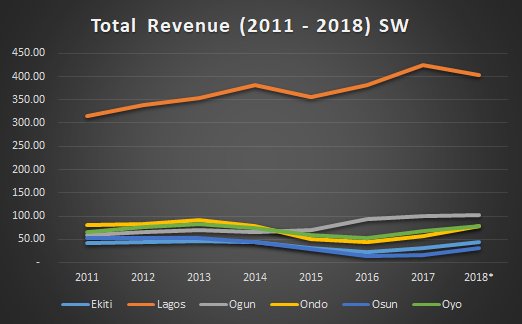
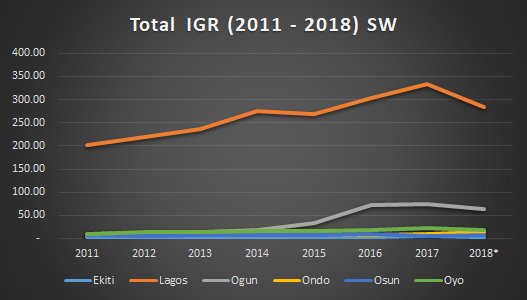
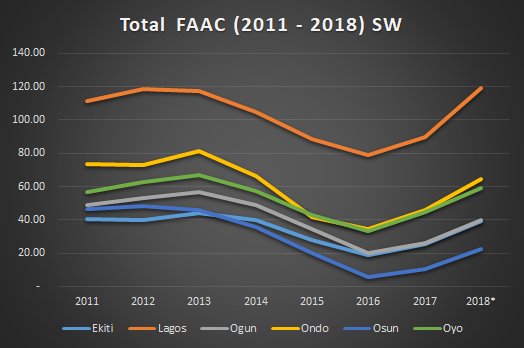
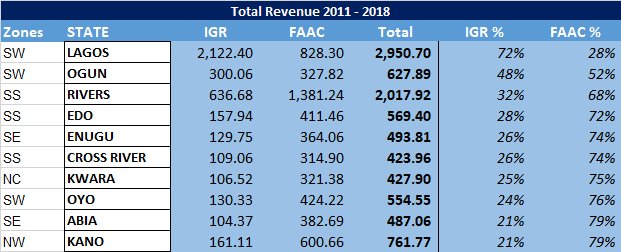
In total, IGR contributes 51% of SW revenue over the period of review, with the highest from Lagos at over 70% and the lowest from Ekiti at 9%. In total, the region accounts for N5.3 Trillion of total revenue between 2011 - 2018. #StateOfStates
