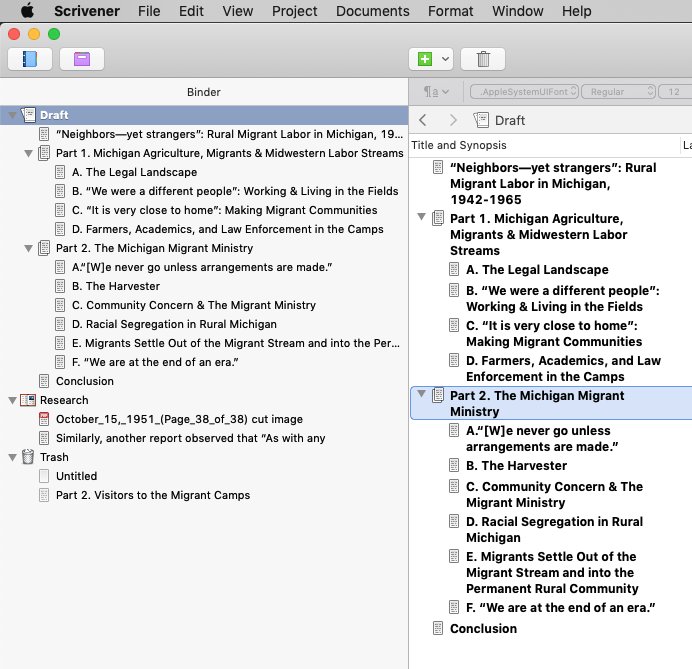
I thought I’d make one last workflow thread about where map-making fits in my dissertation writing. #acawri #phdchat #phdskills ( ) 1/
Maps are the last part of my process because I can best decide which places need visually represented, and how, after the argument is laid out and clear in my head and on paper. 2/
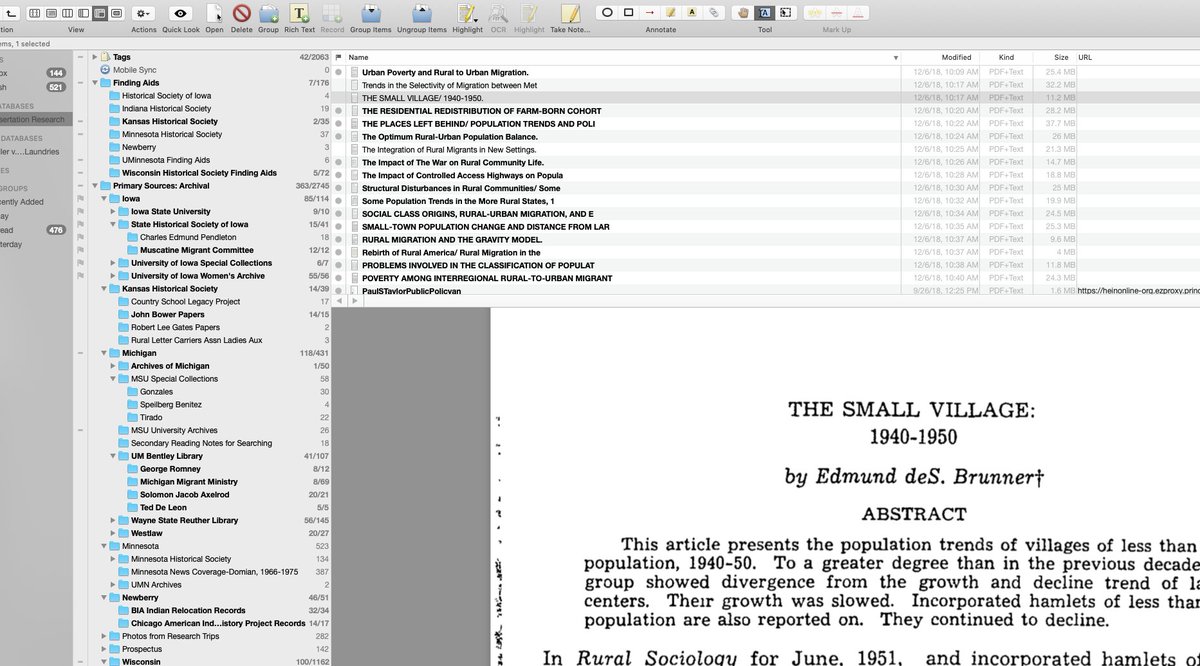
Using a program called Ortelius, I start with maps I’ve gathered in the archives and Google maps. These base layer maps serve as guides to draw new maps highlighting features I discussed in a chapter. 3/
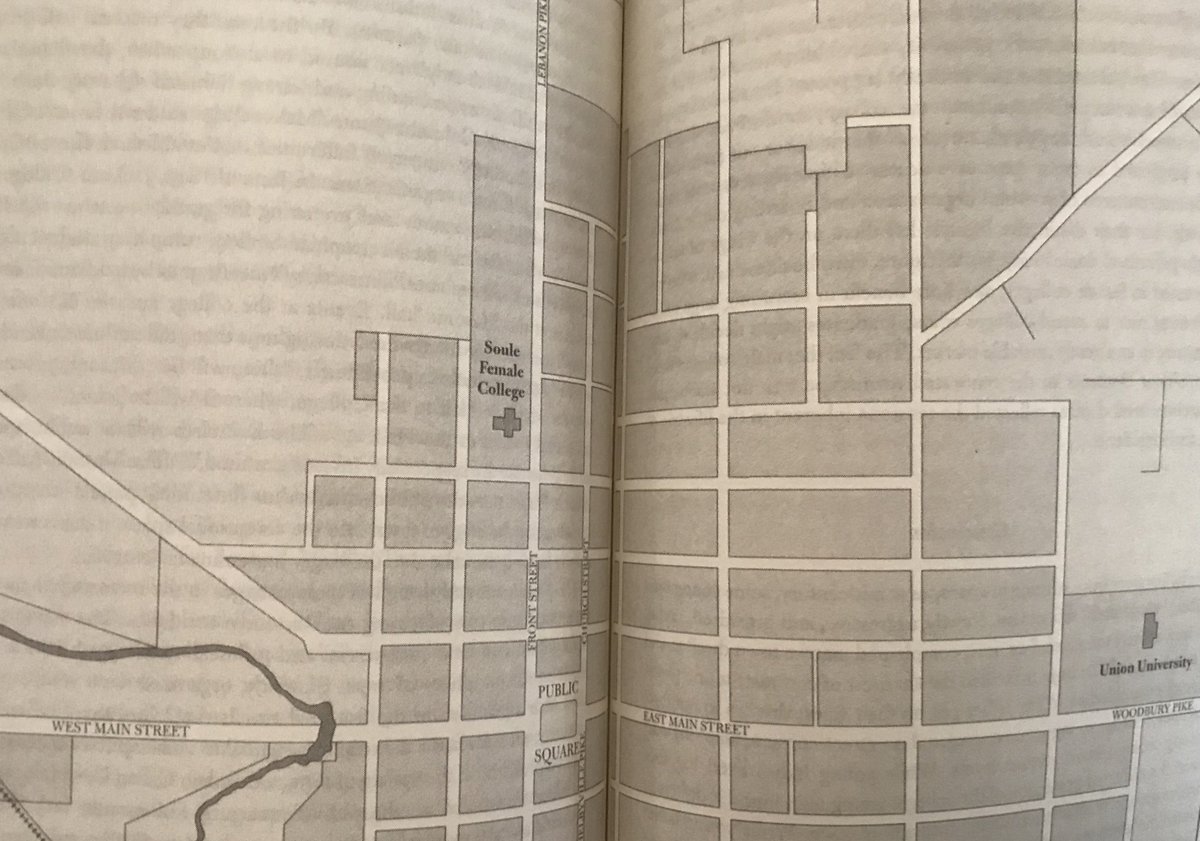
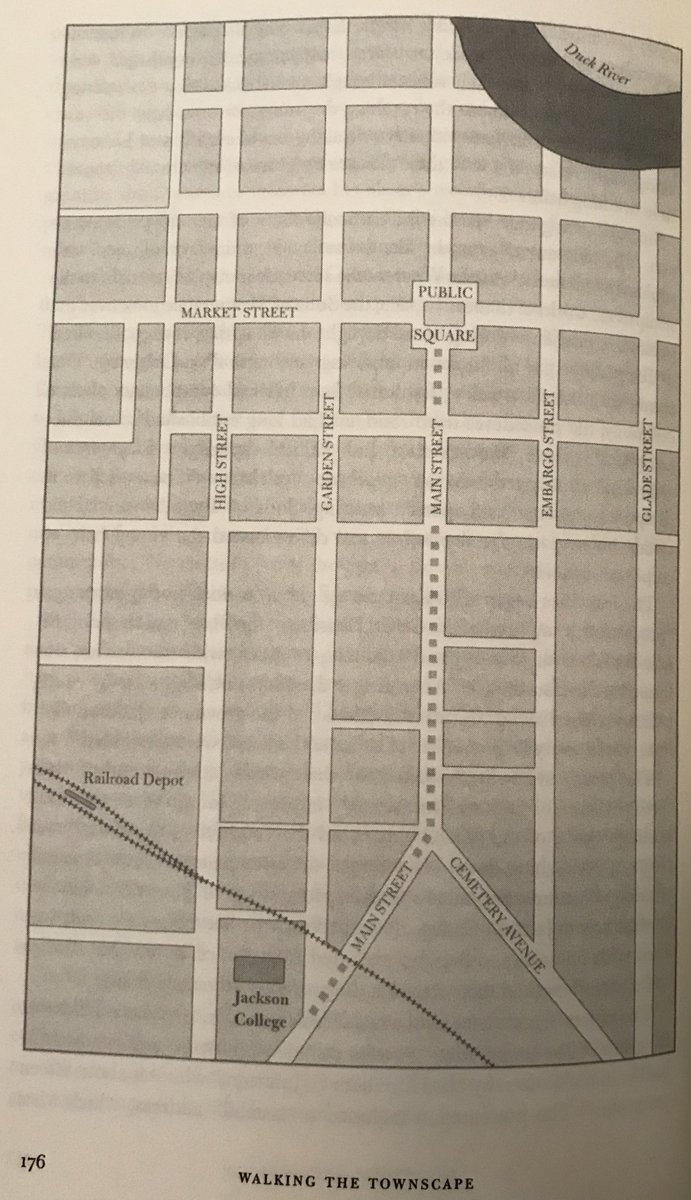
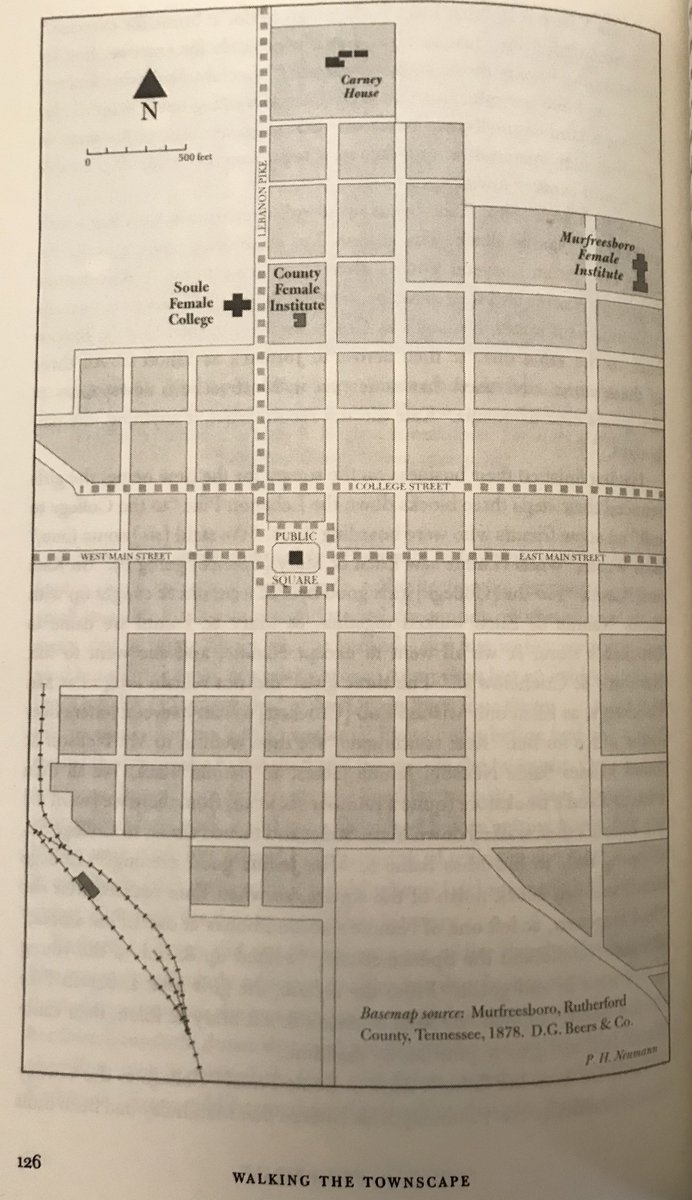
Before drawing a new map, however, I recommend identifying maps from books and articles that you found *both* useful and aesthetically pleasing. I really like the maps in Lisa Tolbert’s Constructing Townscapes (@uncpressblog), and mimicked the color pallet and design of those. 4/ 
Once you have your inspiration, and your source map, Ortelius allows you to draw layers of roads, landmarks, etc. 5/
Here’s my take-away: In addition to reading maps as primary sources, I consider maps an important part of the argument I’m making to my reader. Sometimes, I use historical maps found in the archive; sometimes, I need to make my own to better make my argument. 6/
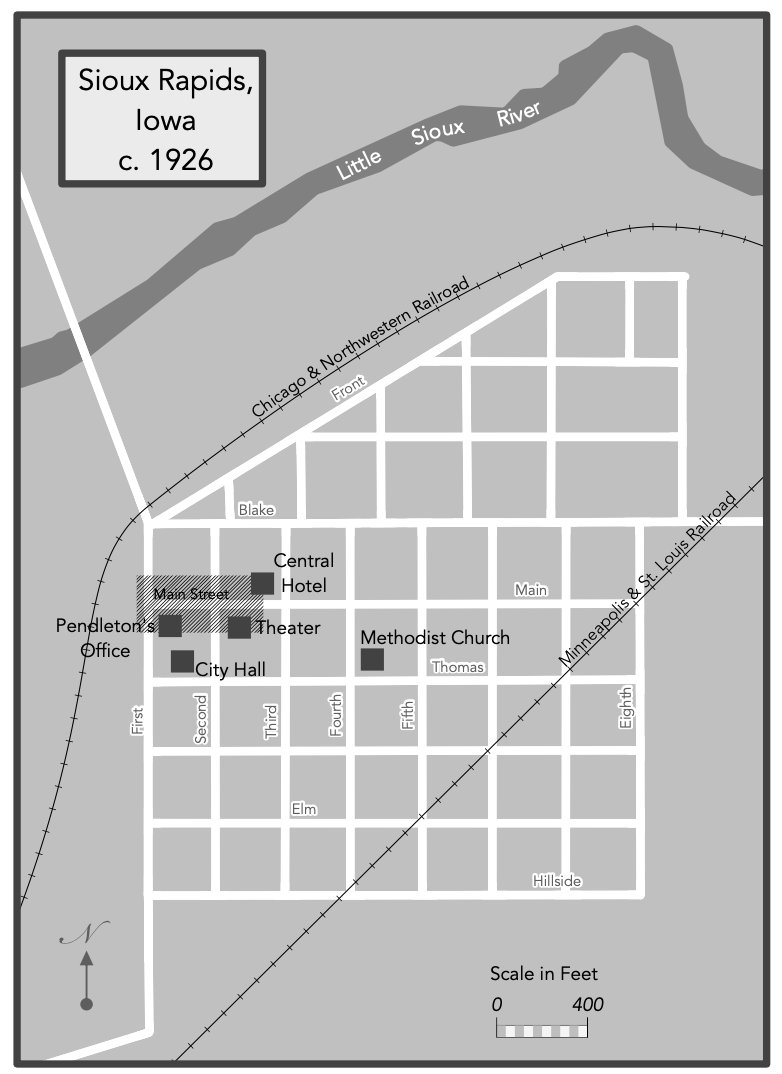
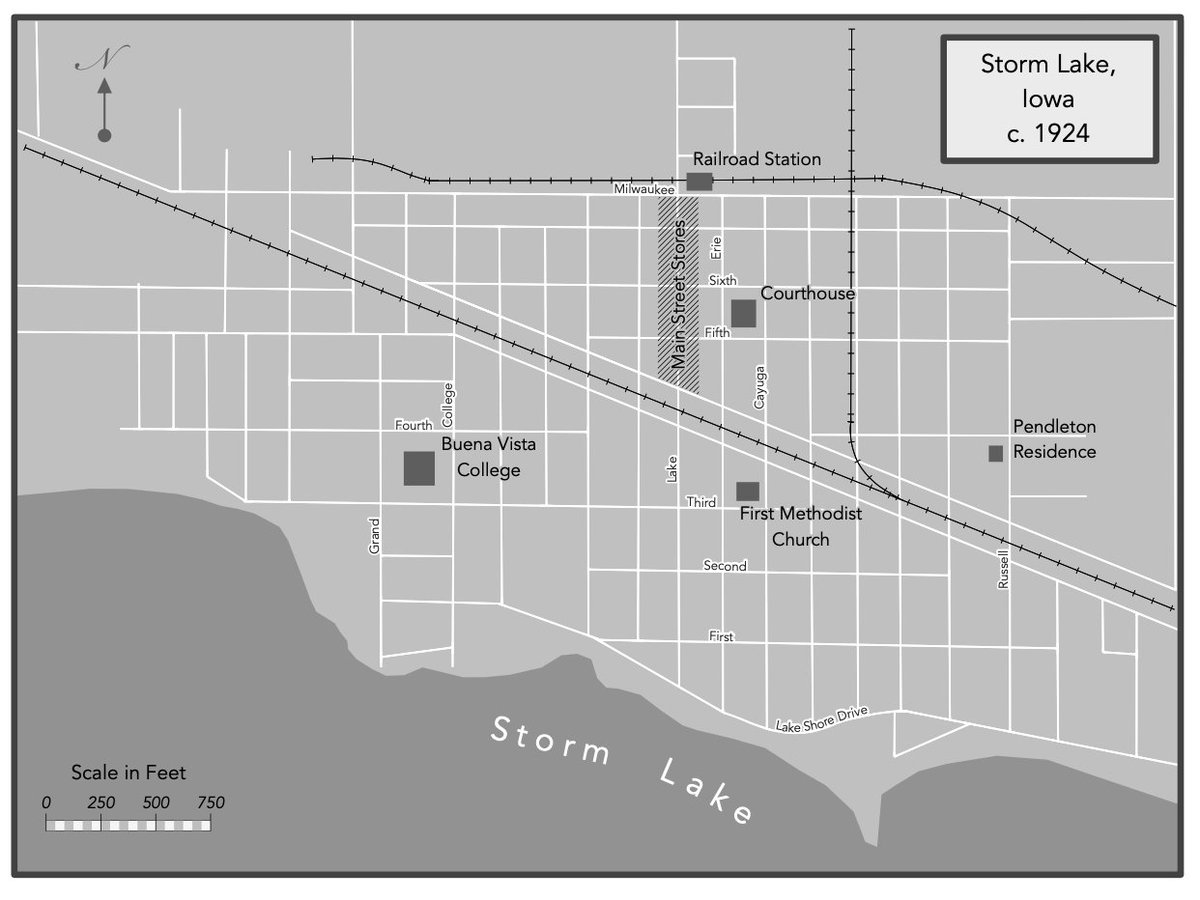
Here are two maps from my chapter about a #rural lawyer in Iowa. I made this with the intention of showing readers the scale of the communities and the proximity of his office to other key community locations where important events took place. 7/

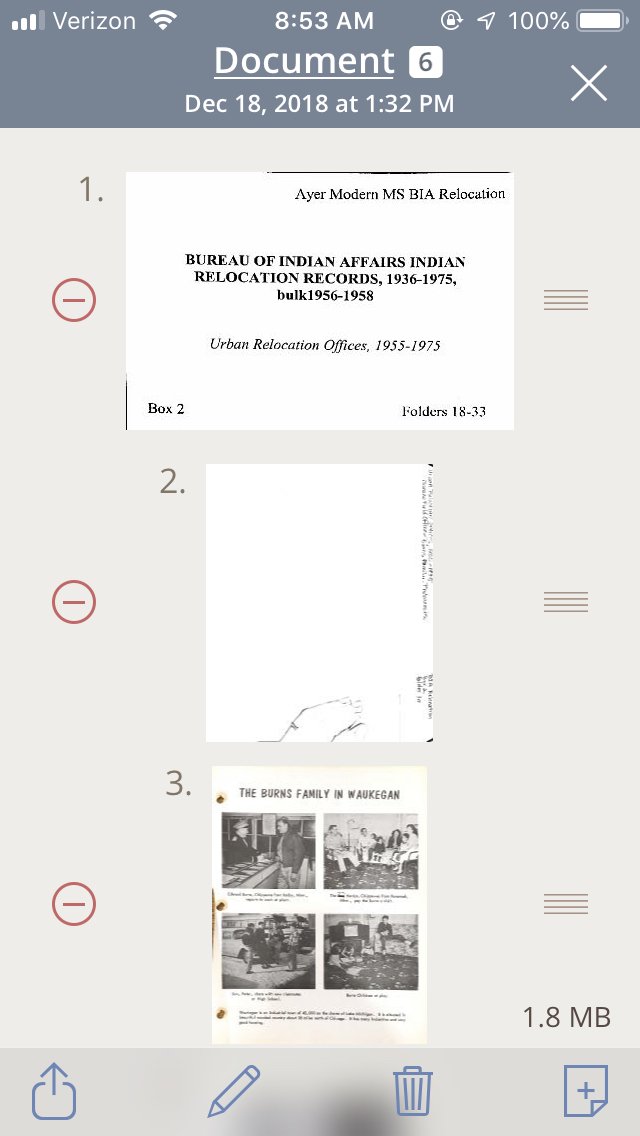
I used the multiple variations of the Midwest population map to show a specific type of change over time. But in this single Midwest map of Native land referenced in a different chapter, I used it to show the distance between rural reservations and urban sites of relocation. 9/

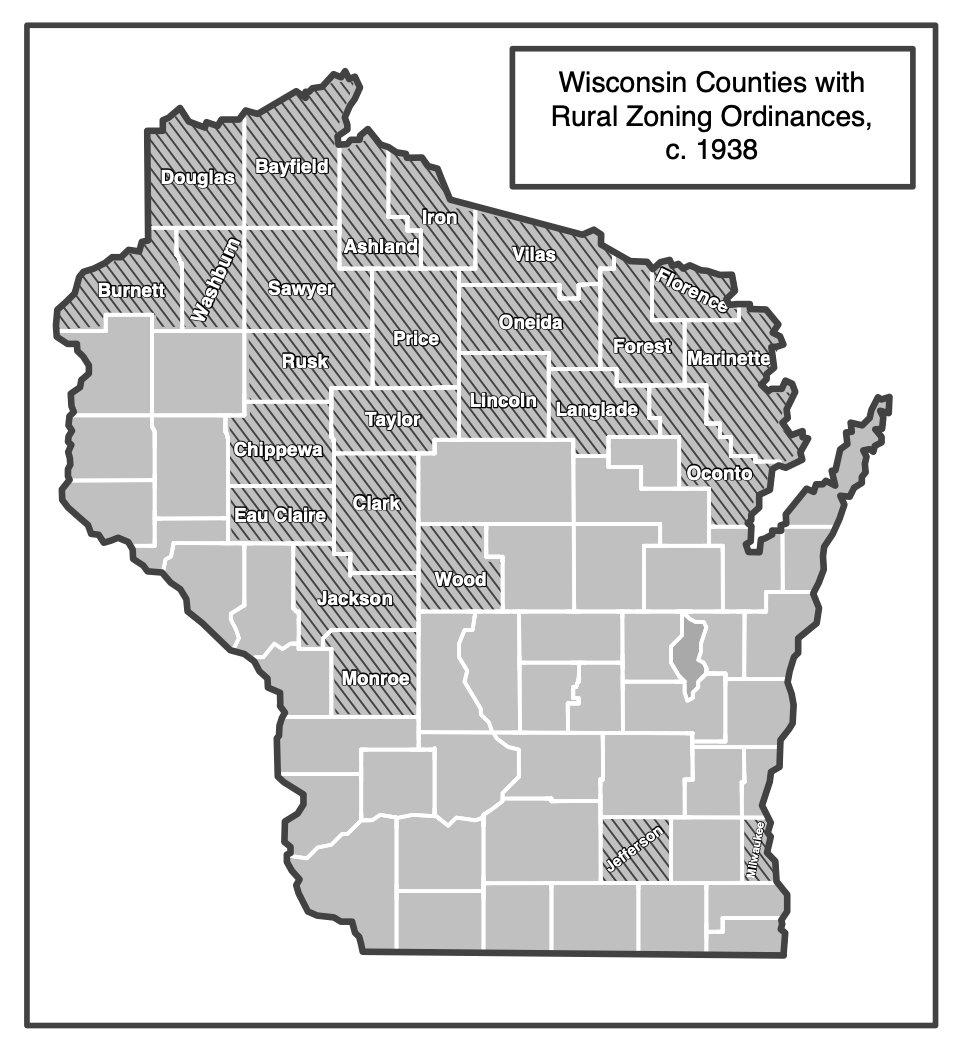
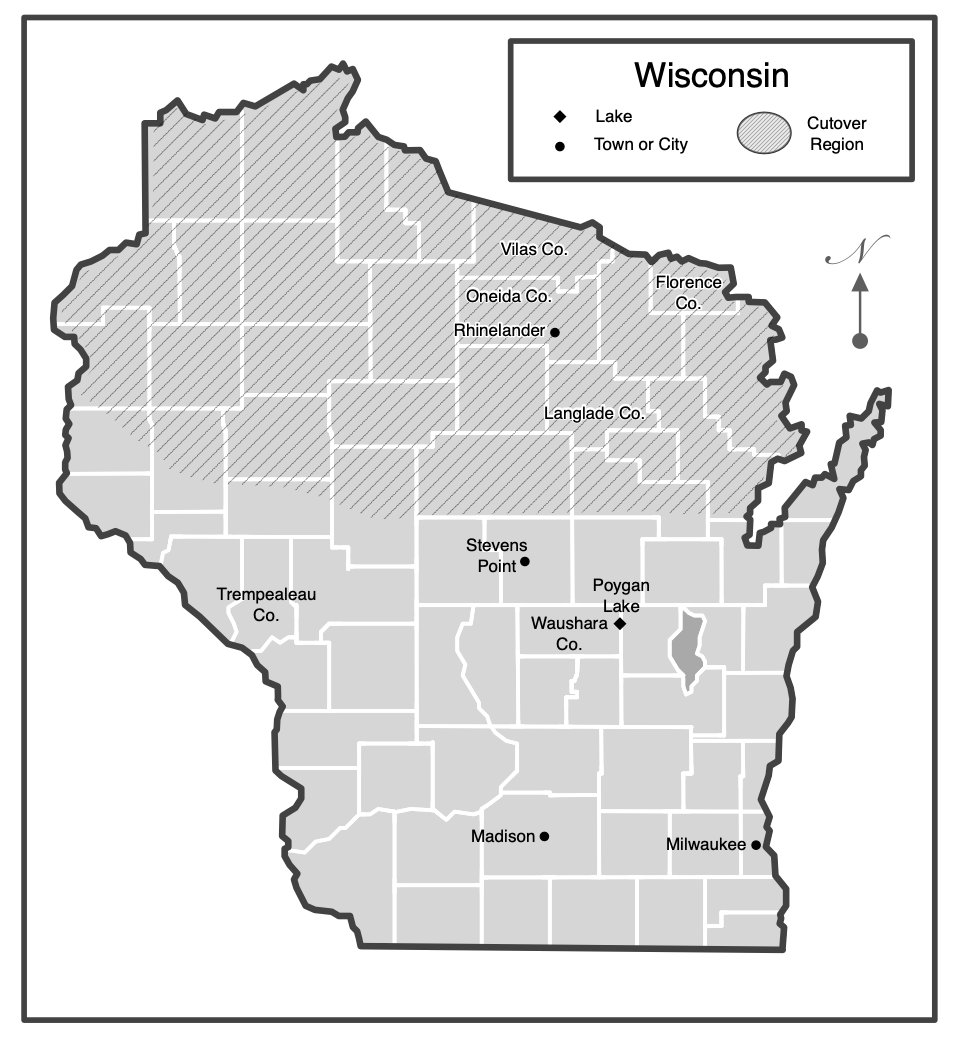
For these two maps of Wisconsin, my argument was of a different variation—I wanted to visually contrast a regional economic base with a specific type of local #zoning ordinance. 10/
FWIW: Ortelius (@mapdiva) is expensive on a grad student budget, even the education version. But, it’s easy to learn. I watched this 9 minute tutorial (admittedly several times) and was able to create these functional if not always elegant maps. youtube.com/watch?v=vh-Tsz… 11/
I’m VERY anxious to hear hacks and tricks from others who have created maps (maybe with a less expensive program?) as part of their writing process. (I’m looking at you, @m_r_glass) Show off those maps! 🗺 12/12
@m_r_glass @threadreaderapp unroll