
,
46 tweets,
40 min read
Read on Twitter
I'm trying to see if people grok the results of @apple Heart Study.
What do you think the sensitivity of the device is for an episode of AF?
(pick closest estimate)
What do you think the sensitivity of the device is for an episode of AF?
(pick closest estimate)
@Apple If you need a hint... this is the slides the investigators summarized the data on.
(It may or may not have the answer)
(It may or may not have the answer)

@Apple @DrMarthaGulati @cardiobrief @drjohnm @bnallamo @mmamas1973 @ADAlthousePhD @f2harrell @onco_cardiology @purviparwani @RogueRad I'm going to wait until about 200+ votes before proceeding. This is an important tweetorial. Please build up interest by retweeting the first tweet in this thread.
Depending on time/interest, we will cover:
1. Diagnostic accuracy
2. Bias
3. Costs of trials
Depending on time/interest, we will cover:
1. Diagnostic accuracy
2. Bias
3. Costs of trials
@Apple @DrMarthaGulati @cardiobrief @drjohnm @bnallamo @mmamas1973 @ADAlthousePhD @f2harrell @onco_cardiology @purviparwani @RogueRad Okay, I'm impatient.
Let's start here.
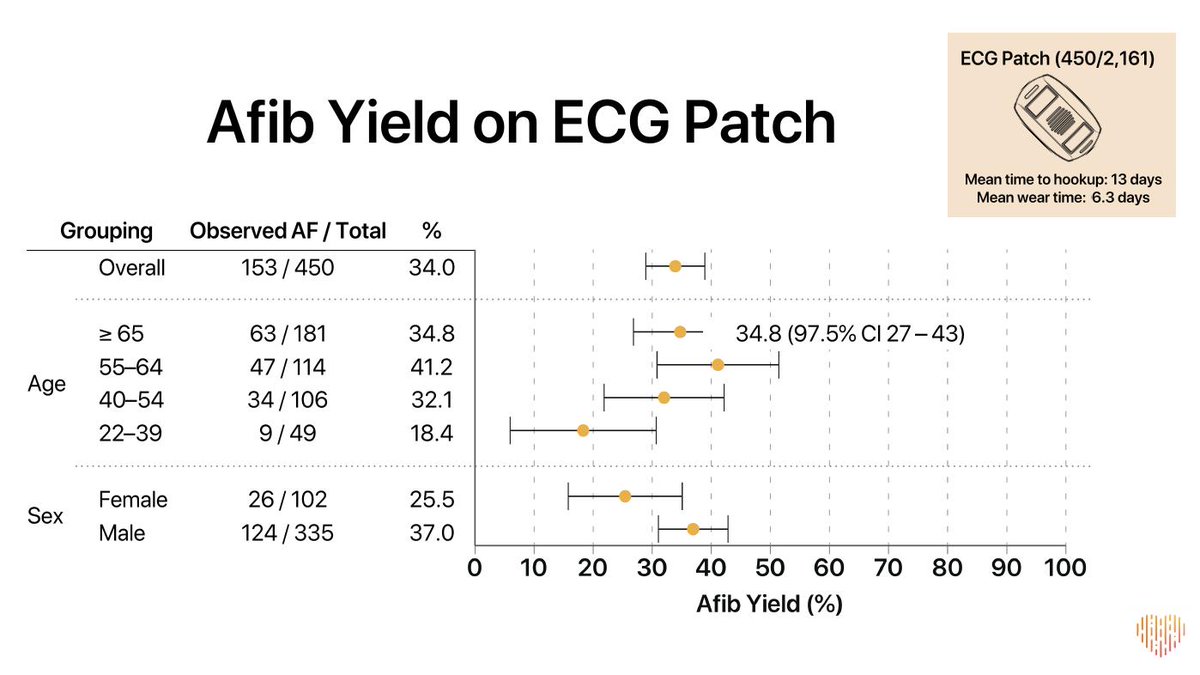
What is the prevalence of AF in the population who wore an ECG patch?
It's 33%. That is pretty high!
Let's start here.
What is the prevalence of AF in the population who wore an ECG patch?
It's 33%. That is pretty high!
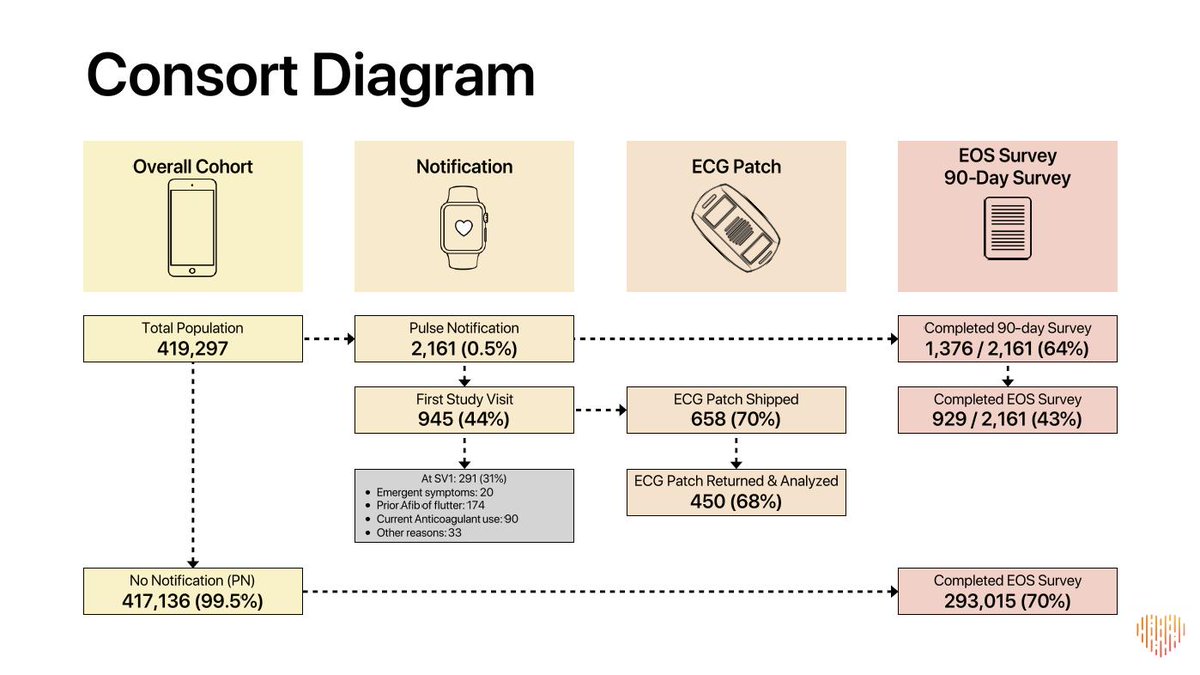
@Apple @DrMarthaGulati @cardiobrief @drjohnm @bnallamo @mmamas1973 @ADAlthousePhD @f2harrell @onco_cardiology @purviparwani @RogueRad @AngryCardio @EPICEMRparody @EpiEllie @oncology_bg @matthewherper @jamesheathers @iamritu @reverendofdoubt @mikejohansen2 @stephensenn How many people (out of 450) DID NOT have AF based on gold standard ECG patch?
The answer is 450 (total patches) -153 (with AF) = 297
This number is the total of True Negatives + False Positives
The answer is 450 (total patches) -153 (with AF) = 297
This number is the total of True Negatives + False Positives
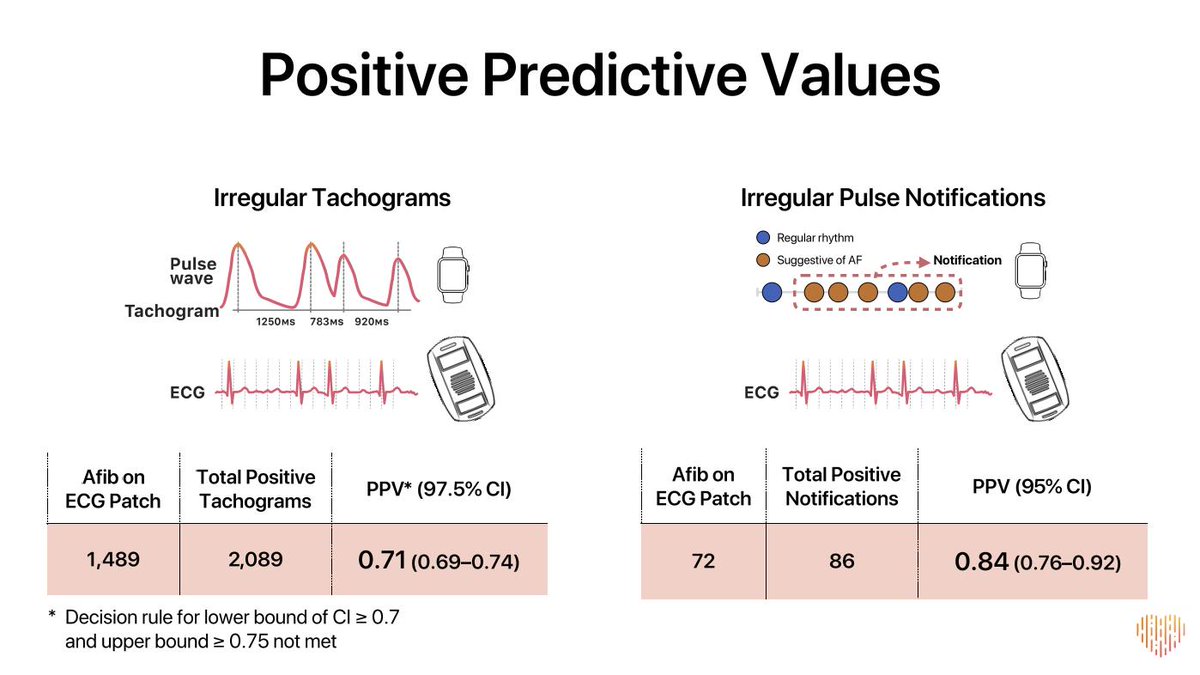
@Apple @DrMarthaGulati @cardiobrief @drjohnm @bnallamo @mmamas1973 @ADAlthousePhD @f2harrell @onco_cardiology @purviparwani @RogueRad @AngryCardio @EPICEMRparody @EpiEllie @oncology_bg @matthewherper @jamesheathers @iamritu @reverendofdoubt @mikejohansen2 @stephensenn How many false positives were there?
The answer is on this slide:
Total notifications of 86 MINUS 72 confirmed on patch (True Positives)
So there were 14 FALSE POSITIVES
The answer is on this slide:
Total notifications of 86 MINUS 72 confirmed on patch (True Positives)
So there were 14 FALSE POSITIVES
@Apple @DrMarthaGulati @cardiobrief @drjohnm @bnallamo @mmamas1973 @ADAlthousePhD @f2harrell @onco_cardiology @purviparwani @RogueRad @AngryCardio @EPICEMRparody @EpiEllie @oncology_bg @matthewherper @jamesheathers @iamritu @reverendofdoubt @mikejohansen2 @stephensenn @keaglemd @umichCVC @barttels2 @djc795 @AnastasiaSMihai @anish_koka So this means the TRUE NEGATIVES were 297-14 or 283!
@Apple @DrMarthaGulati @cardiobrief @drjohnm @bnallamo @mmamas1973 @ADAlthousePhD @f2harrell @onco_cardiology @purviparwani @RogueRad @AngryCardio @EPICEMRparody @EpiEllie @oncology_bg @matthewherper @jamesheathers @iamritu @reverendofdoubt @mikejohansen2 @stephensenn @keaglemd @umichCVC @barttels2 @djc795 @AnastasiaSMihai @anish_koka Okay, so now we know:
True negatives = 283
False positives = 14
True positives = 72
Now we just need the false negatives....
True negatives = 283
False positives = 14
True positives = 72
Now we just need the false negatives....
@Apple @DrMarthaGulati @cardiobrief @drjohnm @bnallamo @mmamas1973 @ADAlthousePhD @f2harrell @onco_cardiology @purviparwani @RogueRad @AngryCardio @EPICEMRparody @EpiEllie @oncology_bg @matthewherper @jamesheathers @iamritu @reverendofdoubt @mikejohansen2 @stephensenn @keaglemd @umichCVC @barttels2 @djc795 @AnastasiaSMihai @anish_koka Given the total is 450, this means the false negatives were 81.
That is astoundingly large to me.
That is astoundingly large to me.
Why? because it means we only catch 72 AF episodes in this high risk population and miss 81!
So that means the sensitivity is 72 / (72 + 81) = 47%
So that means the sensitivity is 72 / (72 + 81) = 47%
Is that a good sensitivity?
We can also calculate specificity:
There were 283 TRUE NEGATIVES and 14 FALSE POSITIVES
This means specificity = 283 / (283 + 14) = 95%
That is pretty good, but not great for screening low risk people.
There were 283 TRUE NEGATIVES and 14 FALSE POSITIVES
This means specificity = 283 / (283 + 14) = 95%
That is pretty good, but not great for screening low risk people.
After a brief break, I will talk about how the watch is probably even less sensitive than this and probably more specific.
The 450 people who wore patches, continued to wear the watch as well.
This is from the second primary endpoint (the first is merely descriptive with no gold standard, not even necessarily true AF for that endpoint).
This is from the second primary endpoint (the first is merely descriptive with no gold standard, not even necessarily true AF for that endpoint).

Now they pre-specified that they would use the individual "tachogram" as the analytic unit, but from a practical perspective the individual notification makes more sense to me (and is better for the watch).
Now, let's play a game about what the "real" sensitivity of the device probably was.
Let's start by focusing on the two largest subgroups by age.
Let's start by focusing on the two largest subgroups by age.

That is the 40-54 year old group and the 22-39 year old group.
For round numbers, this is about 350k people!
For round numbers, this is about 350k people!
What is the prevalence in this age range?
I'm going to guess 0.5% or 2500 out of every 500,000 people
I'm going to guess 0.5% or 2500 out of every 500,000 people
If the device had 95% specificity as noted above and 47% sensitivity, then we would have the following:
Note the very low positive predictive value (4.5%), much less than observed. This can't be right.
Note the very low positive predictive value (4.5%), much less than observed. This can't be right.
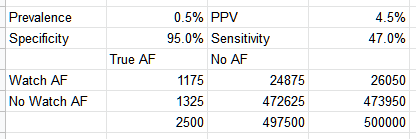
So how do we resolve this??
Well, not everyone who got a notification went on to be sent a patch. Not everyone who was sent a patch wore it.
Well, not everyone who got a notification went on to be sent a patch. Not everyone who was sent a patch wore it.
This is a critical table. Some people hate Table 1. I love it.
Focus on the age ranges of the people notified and who wore a patch. Grossly similar it seems on the percentage breakdown by age who had notifications and patches.
Focus on the age ranges of the people notified and who wore a patch. Grossly similar it seems on the percentage breakdown by age who had notifications and patches.

If you look at the response rate overall it is about 21%.
That is awfully low in my mind. Some may have chosen to get care outside of the study, others may have just blown the whole thing off.
That is awfully low in my mind. Some may have chosen to get care outside of the study, others may have just blown the whole thing off.
People who are FALSE POSITIVES are more likely to blow off confirmatory testing than TRUE POSITIVES.
Is there some hint of that in the data? A teensy one.
Patch response rates for young people were lower than older people & younger people have more FALSE POSITIVE AF readings
Is there some hint of that in the data? A teensy one.
Patch response rates for young people were lower than older people & younger people have more FALSE POSITIVE AF readings

So it seems that the ECG patch cohort is a biased sample compared to the notification cohort. How much?
Well young people (numerically by far biggest group in the study at 220k) were only 61% as likely to wear a patch after a notification than those >=65 (N=24.6K)
Well young people (numerically by far biggest group in the study at 220k) were only 61% as likely to wear a patch after a notification than those >=65 (N=24.6K)
This will bias the data to inflate the positive predictive value, which was only 34% to begin with.
This is okay if you plan to use it in symptomatic pts, where this kind of bias is good. But not so good for screening the masses.
This is okay if you plan to use it in symptomatic pts, where this kind of bias is good. But not so good for screening the masses.
So the only way to keep that PPV in the overall cohort is if the algorithm has even higher specificity than what is estimated in the above exercise. But higher specificity almost always means lower sensitivity.
The only way around the tradeoff between specificity and sensitivity is to change the algorithm. Otherwise, you are almost always swapping a bit of one for some of the other.
They certainly didn't change the algorithm mid-study (I hope!)
They certainly didn't change the algorithm mid-study (I hope!)
So end of the day, we have a bias in confirmation (a form of referral bias). This will increase the apparent PPV, lower the apparent specificity and increase the apparent sensitivity.
@EJSMD The distinction here is that 1/3 of people with a notification had LATER confirmation with a 7day patch. This group is lowered by paroxysmal disease.
The 84% is for the smaller group who had a notification while using the patch. This group is enriched with true positives because of referral bias.
The truth is probably in between the two.
The truth is probably in between the two.
The problem is that we have one of the biggest studies in history (the biggest?) and it is leaving tons of open questions precisely because of the compromises related to its bigness.
Which brings me to my last point (before our summary).
This trial was called big and inexpensive. Heralded by many as a new frontier in how to do science.
This trial was called big and inexpensive. Heralded by many as a new frontier in how to do science.
I deeply worry about this. It brings many of the issues of retrospective research to prospective work in that there is massive dropout at important stages.
Dropout that is almost certainly not random (meaning it will bias the numbers in one direction or another).
Dropout that is almost certainly not random (meaning it will bias the numbers in one direction or another).
In the end, this study had two endpoints.
1. For the 1st endpt (N=450k), we don't even know if it is real or not real AF. So I would say the endpoint is not answered in the trial.
1. For the 1st endpt (N=450k), we don't even know if it is real or not real AF. So I would say the endpoint is not answered in the trial.

2. For the 2nd endpt, the trial answers in a way that is biased, and ultimately missed the cutoff (by a smidge)
That second endpoint, is most critical to me and is the only one where we have some "truth" in the form of the ECG patch. The first is just descriptive with no gold standard.
It is done over 450 patients (152 who had AF with the patch on).
It is done over 450 patients (152 who had AF with the patch on).
The trial cost $8.2 million to conduct.
Per patient (over 450 patients where we have any truth at all), that is $18,200 per patient.
Is that cheap? Not to me.
Per patient (over 450 patients where we have any truth at all), that is $18,200 per patient.
Is that cheap? Not to me.
A few closing thoughts and then a summary.
I got a very nice email from Sanjay Kaul. Pointing out that an ITT analysis of @Apple Heart Study would have miserably poor results due to the loss to follow-up. This has major negative implications for using this in RCTs.
I got a very nice email from Sanjay Kaul. Pointing out that an ITT analysis of @Apple Heart Study would have miserably poor results due to the loss to follow-up. This has major negative implications for using this in RCTs.
The PPV will be much worse in groups with lower prevalence (the patch cohort had prevalence of 34%).
So to summarize:
1. Very poor sensitivity, probably around 50%-ish or worse (given biases)
2. Excellent specificity, probably 95%-ish or higher
3. Terrible PPV in all comers
1. Very poor sensitivity, probably around 50%-ish or worse (given biases)
2. Excellent specificity, probably 95%-ish or higher
3. Terrible PPV in all comers
The algorithm has been tuned for specificity over sensitivity. This helps with screening but makes it of less value for monitoring disease burden or diagnosing symptomatic or high risk groups.
Was this helpful?
If you are hungry for more on @apple watch and related tech, here is my collection of related threads:


