,
12 tweets,
13 min read
Read on Twitter
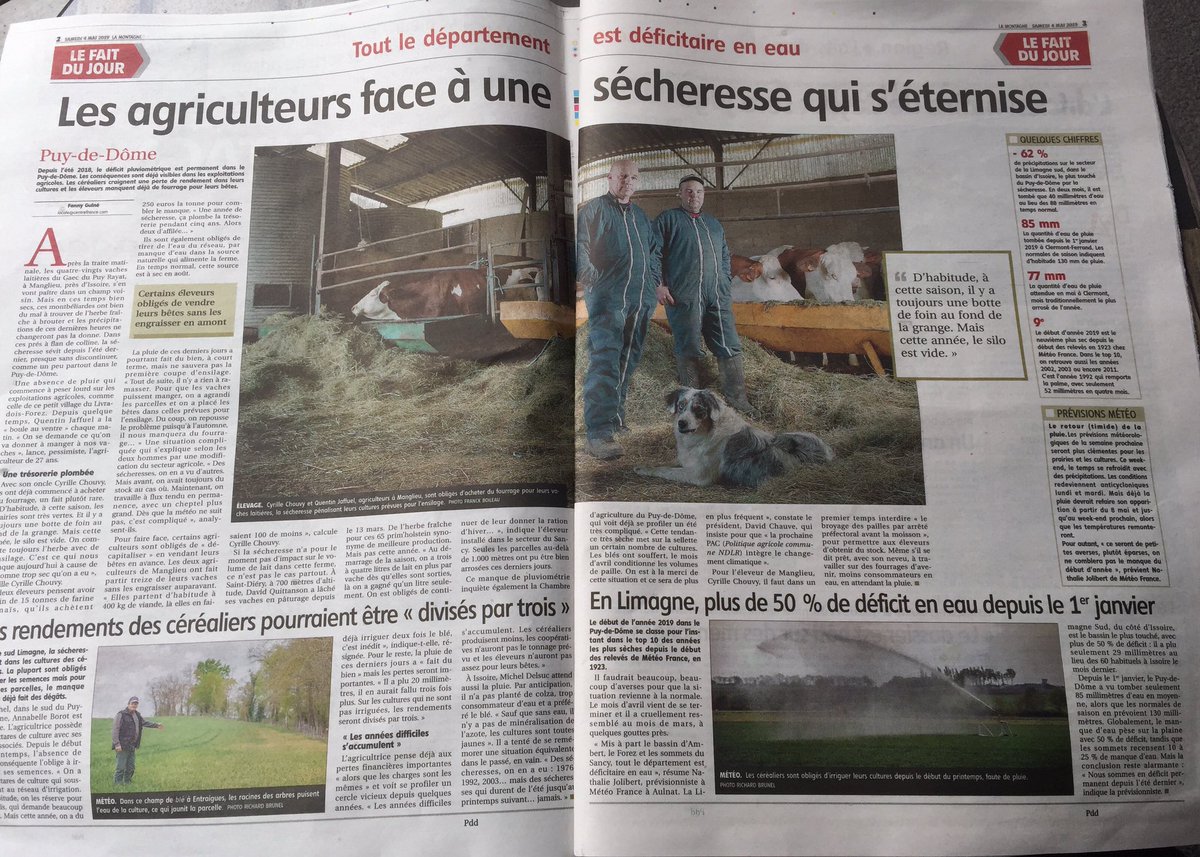
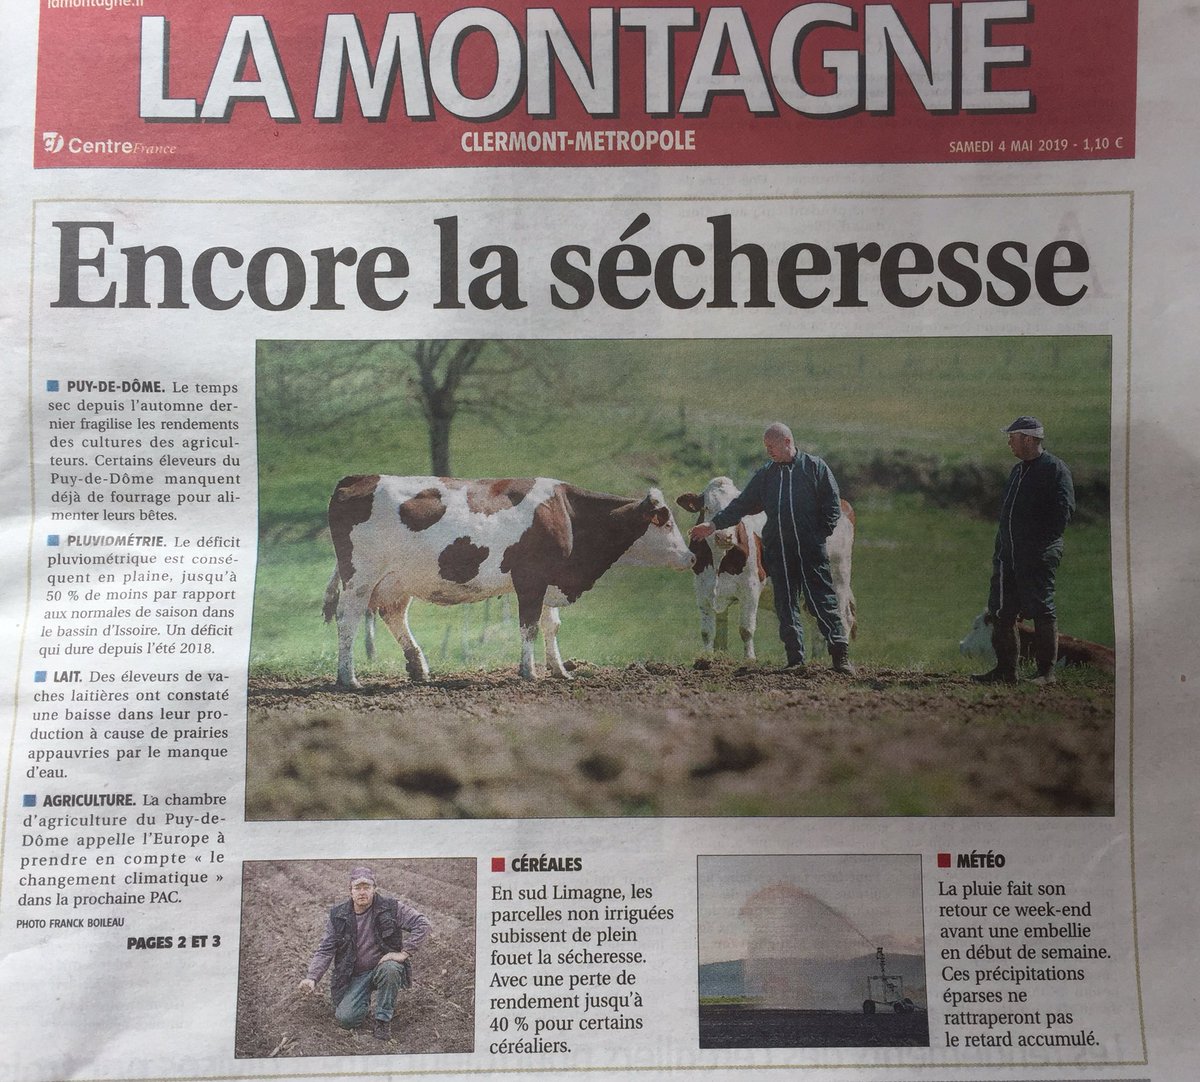
Water deficit affecting agriculture in France's @Departement63 Puy-de-Dome
@FannyGuine bit.ly/puy-sec
* Reduced milk prod. {+1L instead +4L start spring season}
* 66 % lower grain prod.
* Call to adapt Common Agriculural Policy to climate change
Viz below ↓
@FannyGuine bit.ly/puy-sec
* Reduced milk prod. {+1L instead +4L start spring season}
* 66 % lower grain prod.
* Call to adapt Common Agriculural Policy to climate change
Viz below ↓

@CopernicusEMS Combined #Drought Indicator (CDI) - to indicate agricultural *soil drought* [bit.ly/Cop-CDI] - learns:
* winter drought '17 in FR/ES/PRT
* summer drought '18 lasting from July to December in EU
* '17/4, '18/4 : +- no drought <-> '19/4 : FR/ES/Balkans
* winter drought '17 in FR/ES/PRT
* summer drought '18 lasting from July to December in EU
* '17/4, '18/4 : +- no drought <-> '19/4 : FR/ES/Balkans
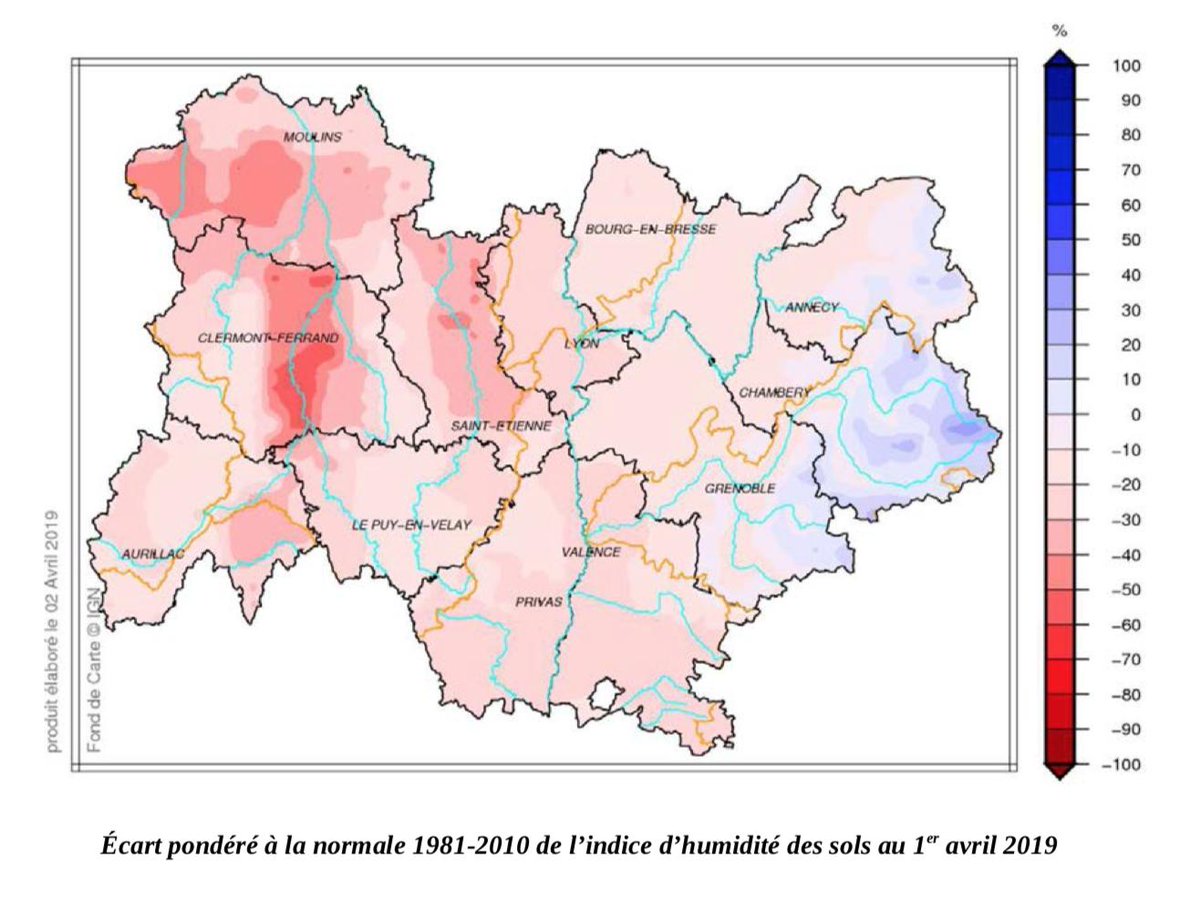
Soil drought in @auvergnerhalpes in line with March DREAL analysis [bit.ly/DREAL-3]:
* Deficit almost everywhere in region compared with 1981-2010
* +- 40% Allier / Puy-de-Dôme / North of the Loire
* > 50% in part of Limagnes
* Deficit almost everywhere in region compared with 1981-2010
* +- 40% Allier / Puy-de-Dôme / North of the Loire
* > 50% in part of Limagnes
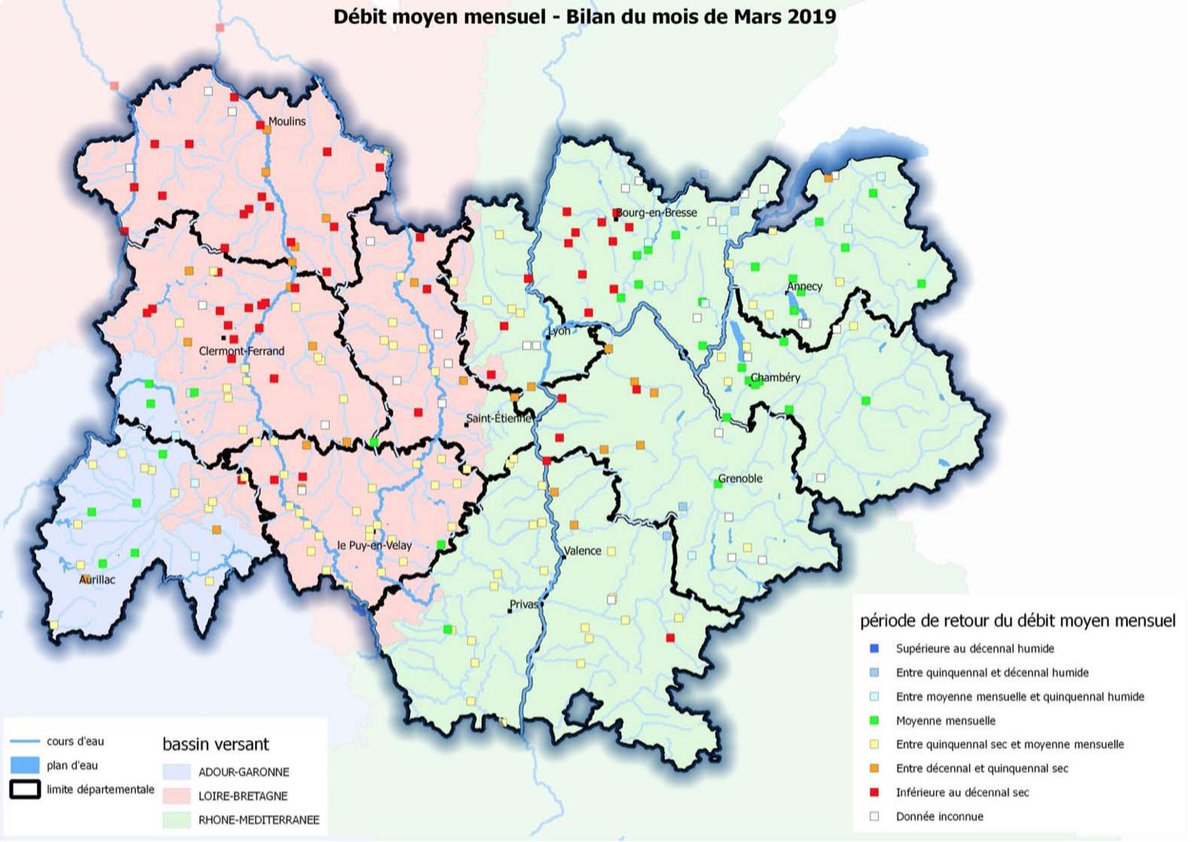
Globally depressed streamflow: a majority of test points has an average flow rate below the 'Five-Year Dry Flow' [= monthly flow with a 4/5 probability of being exceeded each year. It makes it possible to characterize a calendar month of low hydraulicity]
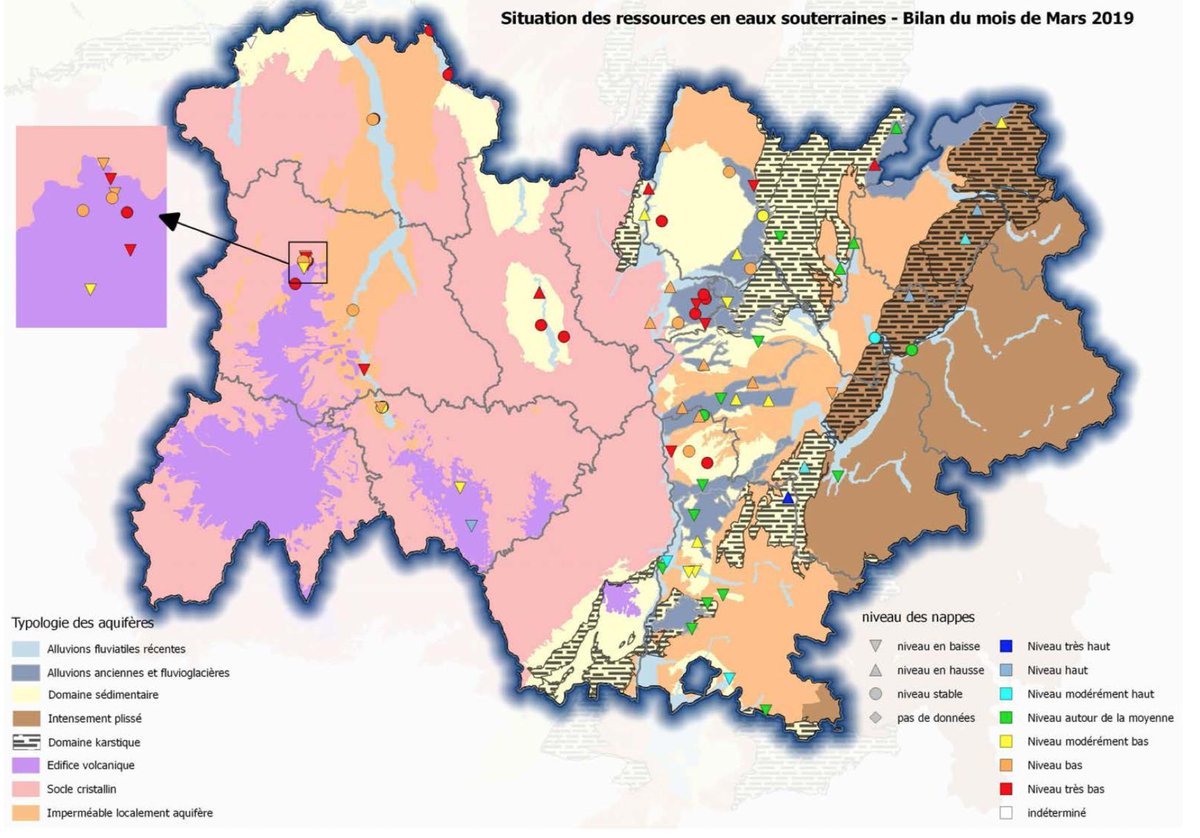
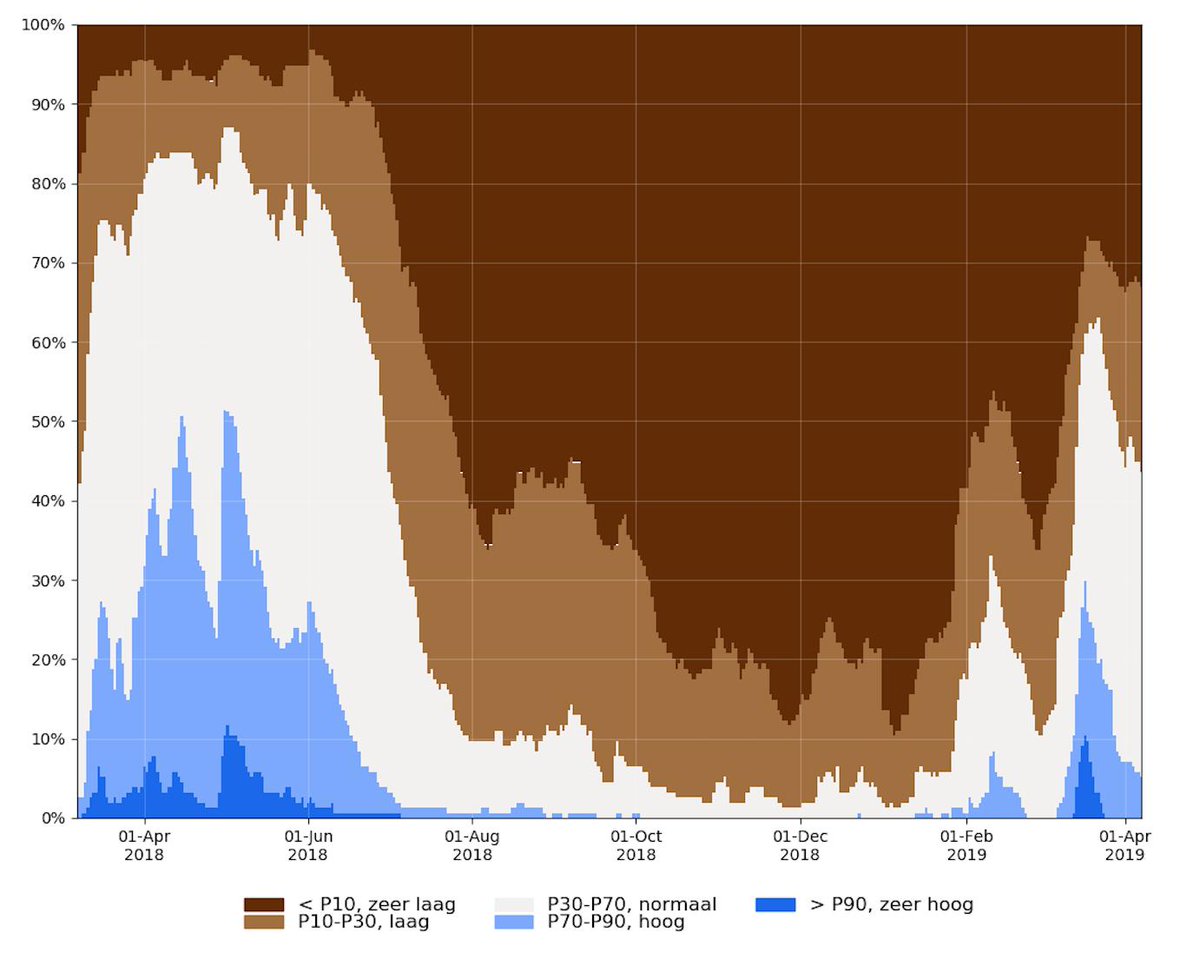
Majority of groundwater in the western part of the @auvergnerhalpes region has a very low level [red / orange dots]. With the recovery of vegetation, only very heavy spring rains are likely to reverse current trends.
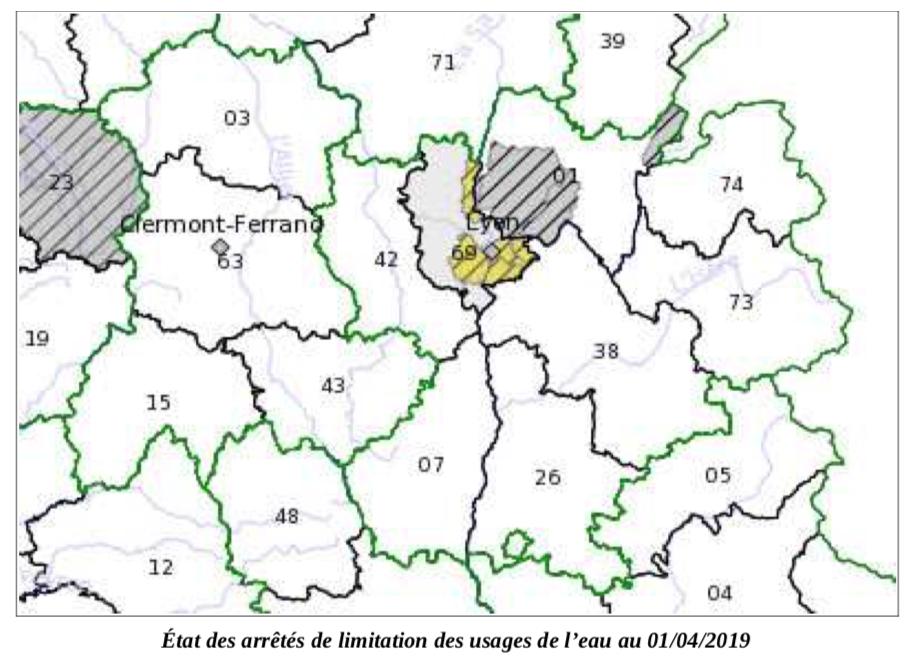
In the @auvergnerhalpes region, 2 departments are vigilant for water use (Ain and Rhône - since April 1).
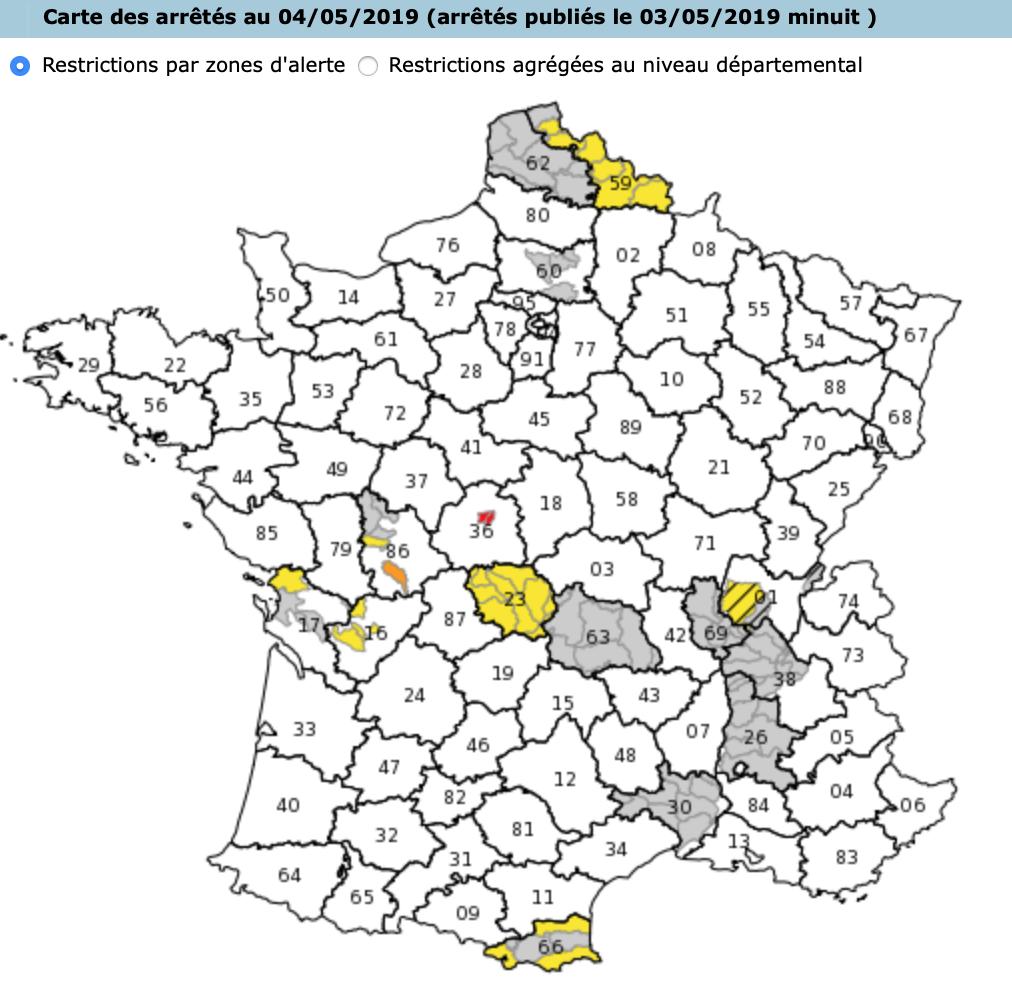
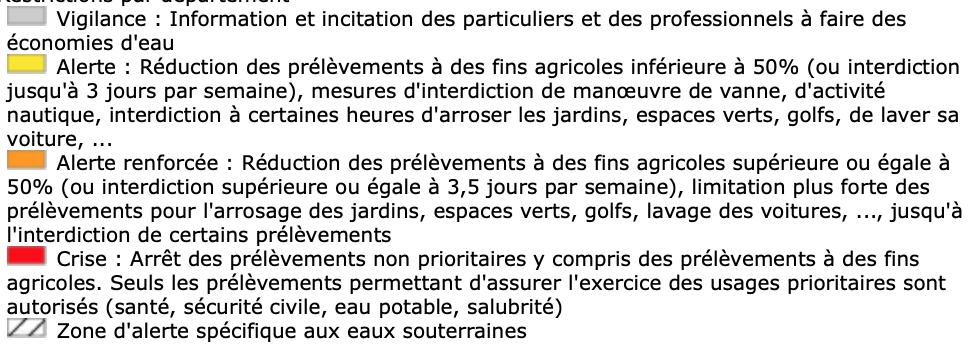
In France, 10 departments have a water usage restriction (beyond vigilance): bit.ly/propluvia
In France, 10 departments have a water usage restriction (beyond vigilance): bit.ly/propluvia
In Belgium (Flanders), a similar deficit in groundwater level is observed: 1/3 of the measurement points are very low [brown], 38% of the measuring points have a normal level [white]. @DOVdovVO A debate is ongoing on water restrictions to avoid shortages during the summer.
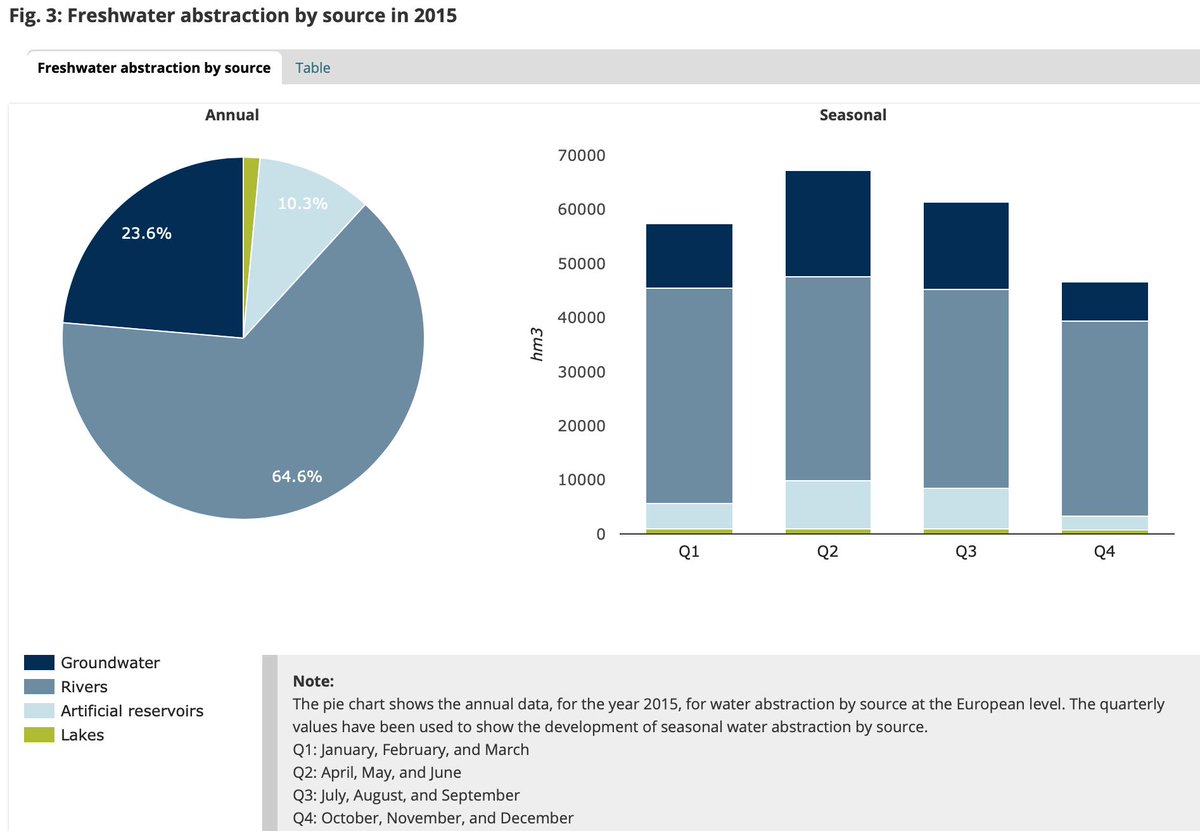
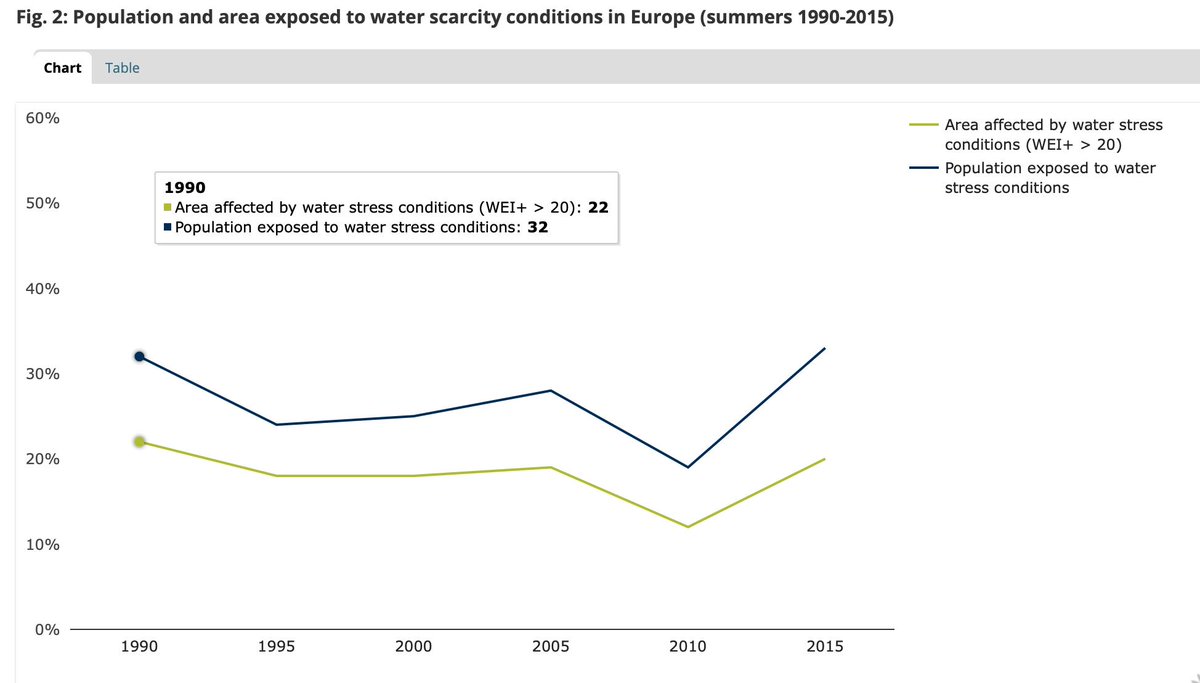
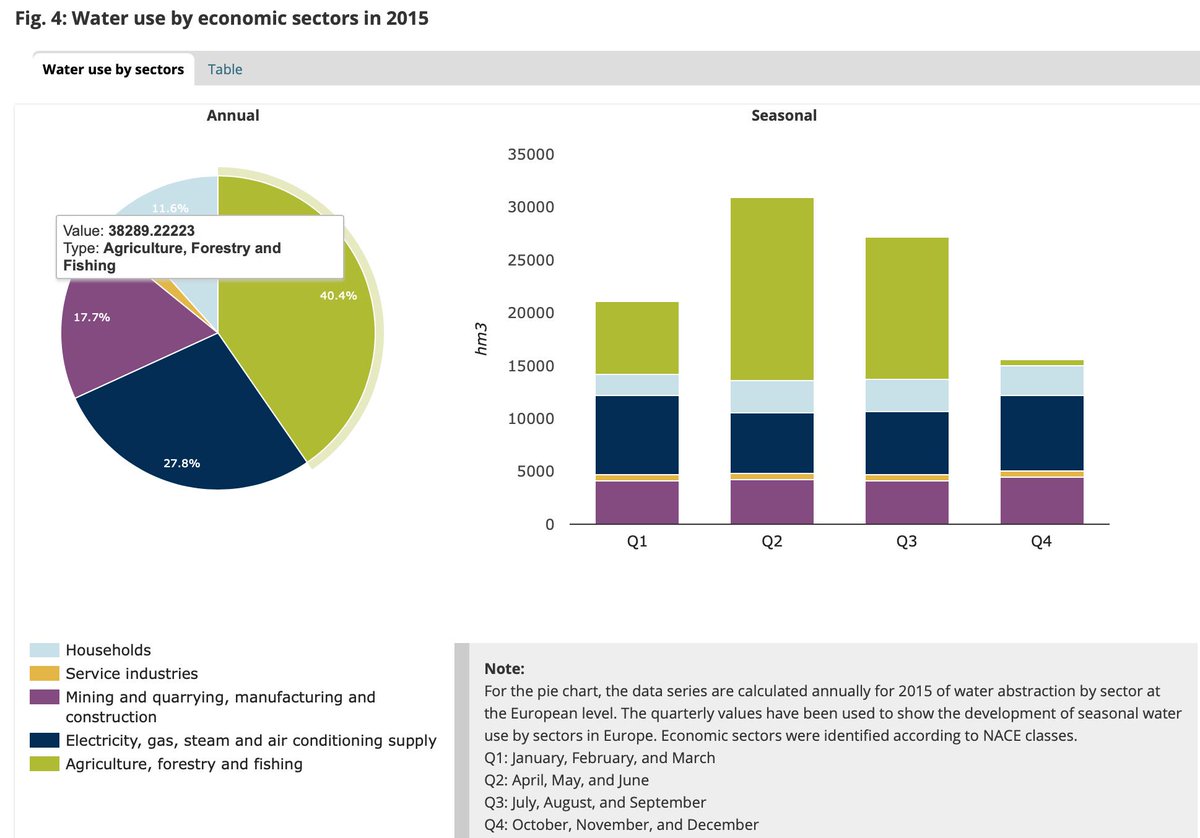
In the EU, @EUEnvironment [latest data 2015, bit.ly/EEA-water] :
* Abstraction from rivers (64%), groundwater (23%) and reservoirs (10%)
* Pop/area affected by water stress ↑
* Water used for agriculture (40%), electricity (27%), mining/constr. (17%), households (11%)
* Abstraction from rivers (64%), groundwater (23%) and reservoirs (10%)
* Pop/area affected by water stress ↑
* Water used for agriculture (40%), electricity (27%), mining/constr. (17%), households (11%)
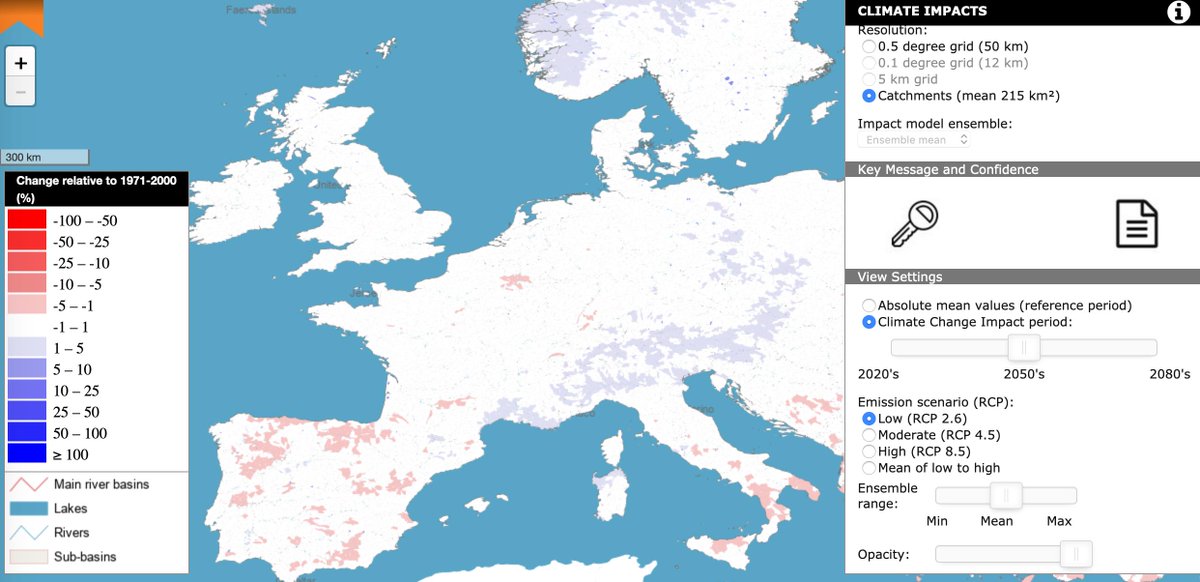
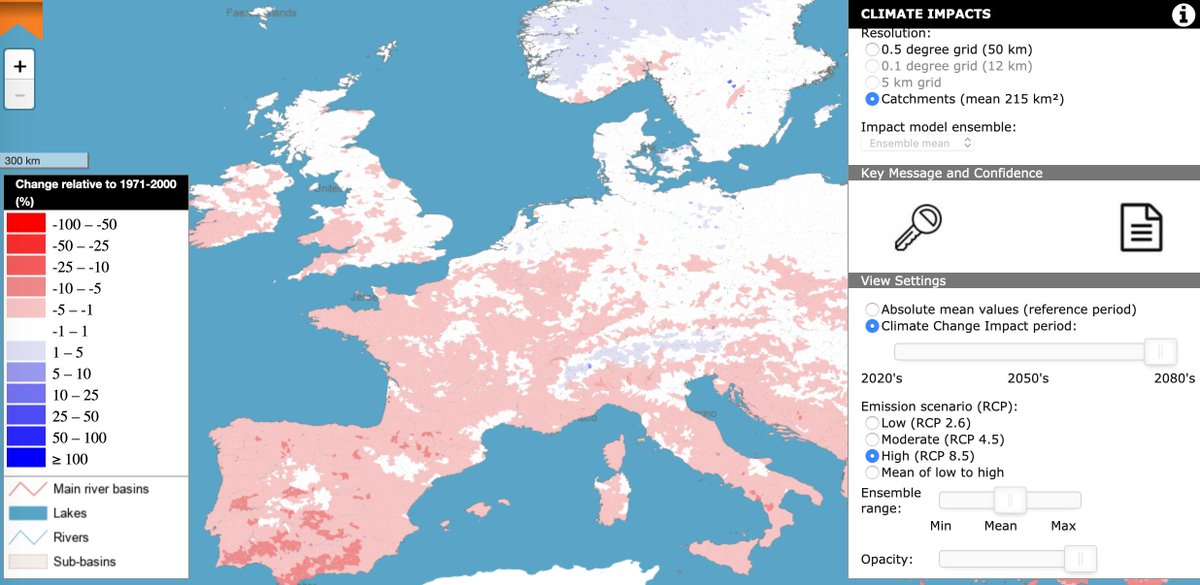
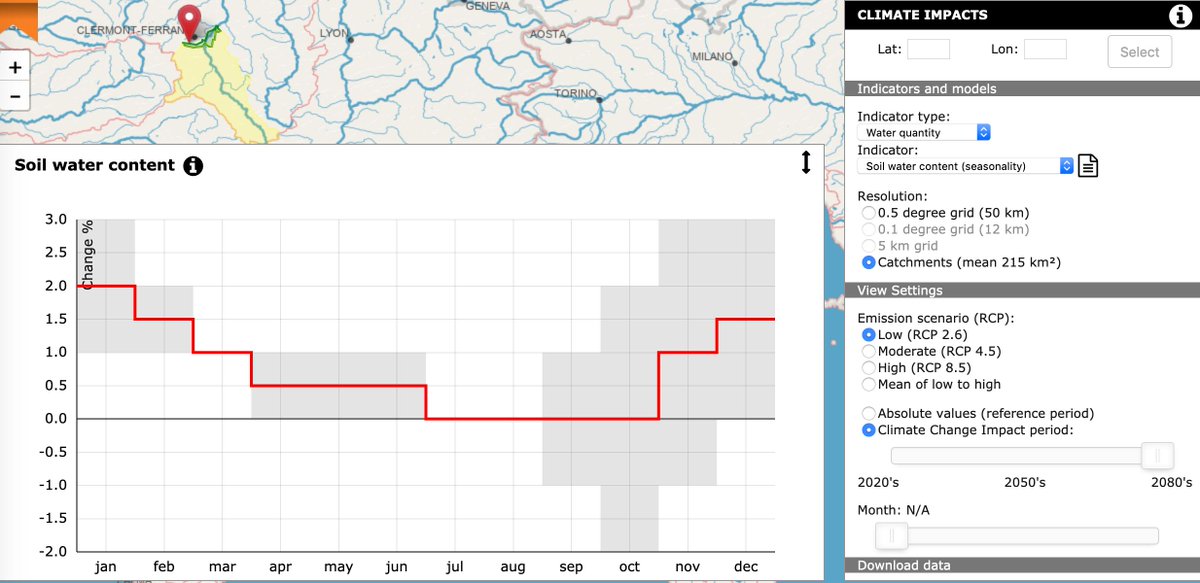
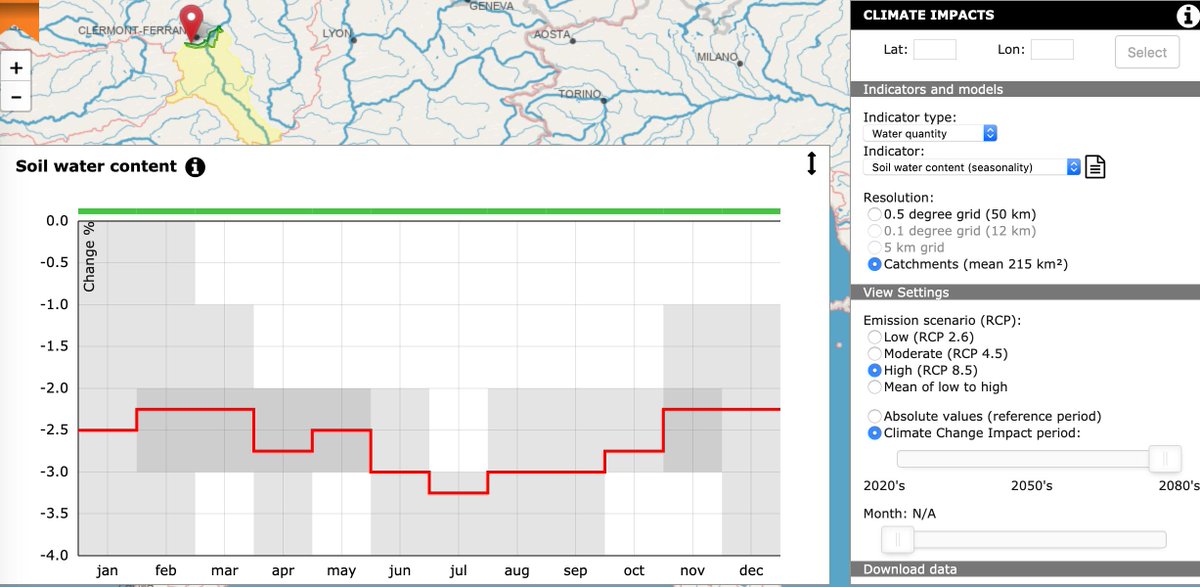
How will the soil water content evolve, depending on future #emissions? #SWICCA @CopernicusECMWF bit.ly/COP-SW
2050:
* higher deficit in the South with high emissions (#RCP 8.5) compared to low emission scenario (#RCP 2.6 = 2° T-rise)
2080:
* difference more outspoken
2050:
* higher deficit in the South with high emissions (#RCP 8.5) compared to low emission scenario (#RCP 2.6 = 2° T-rise)
2080:
* difference more outspoken


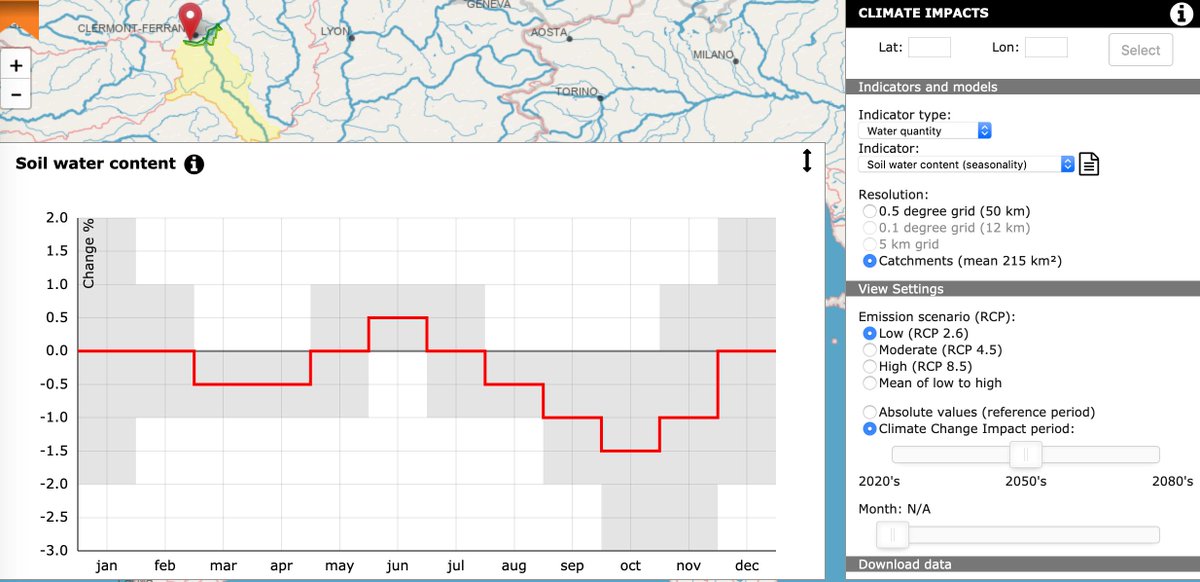
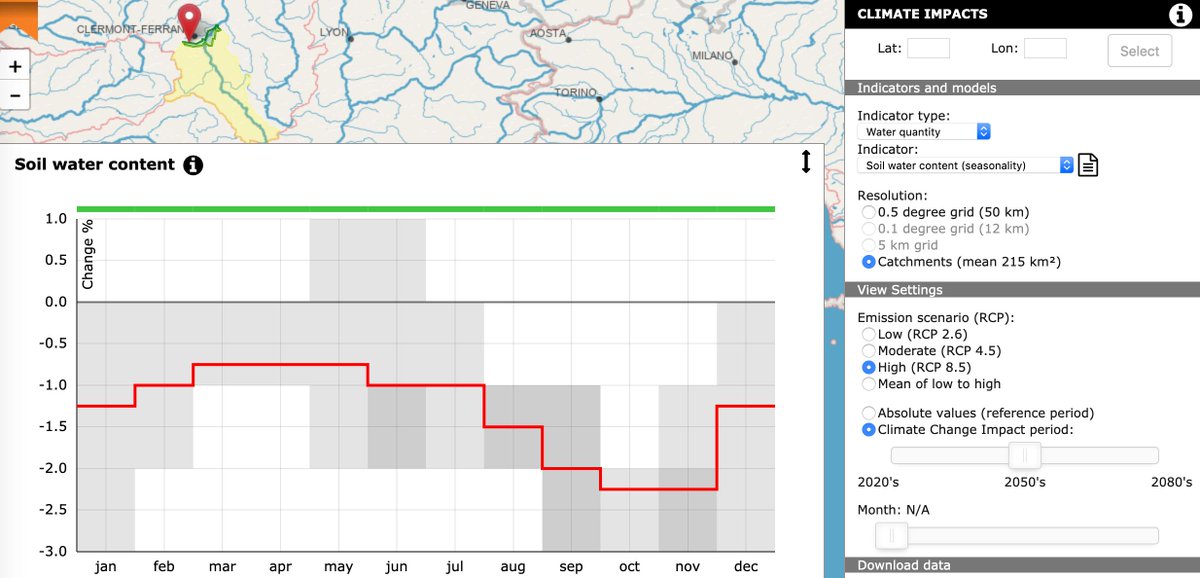
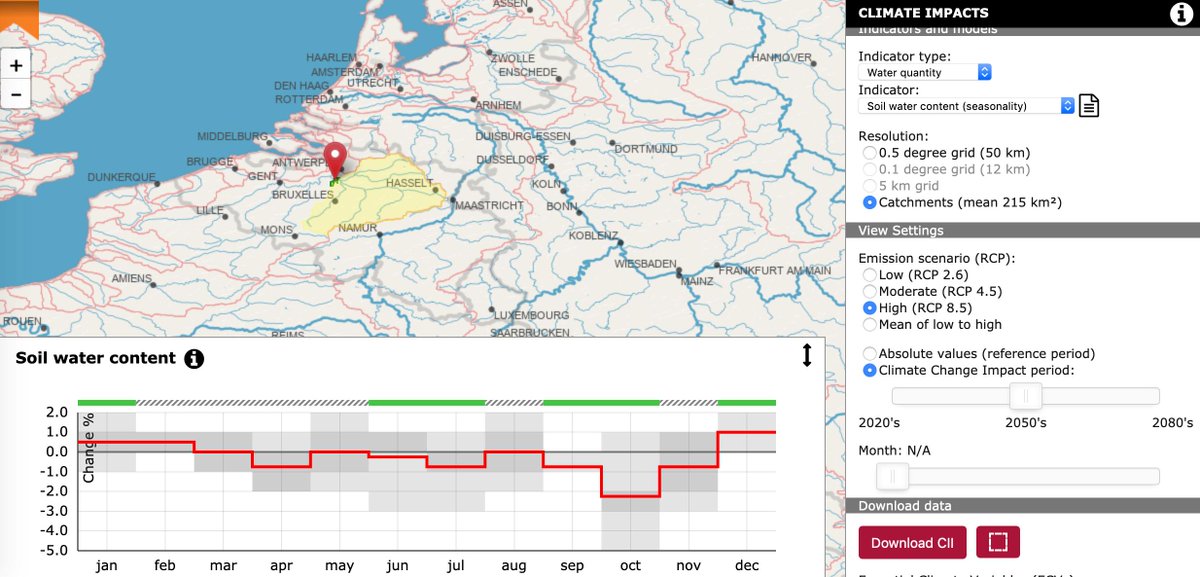
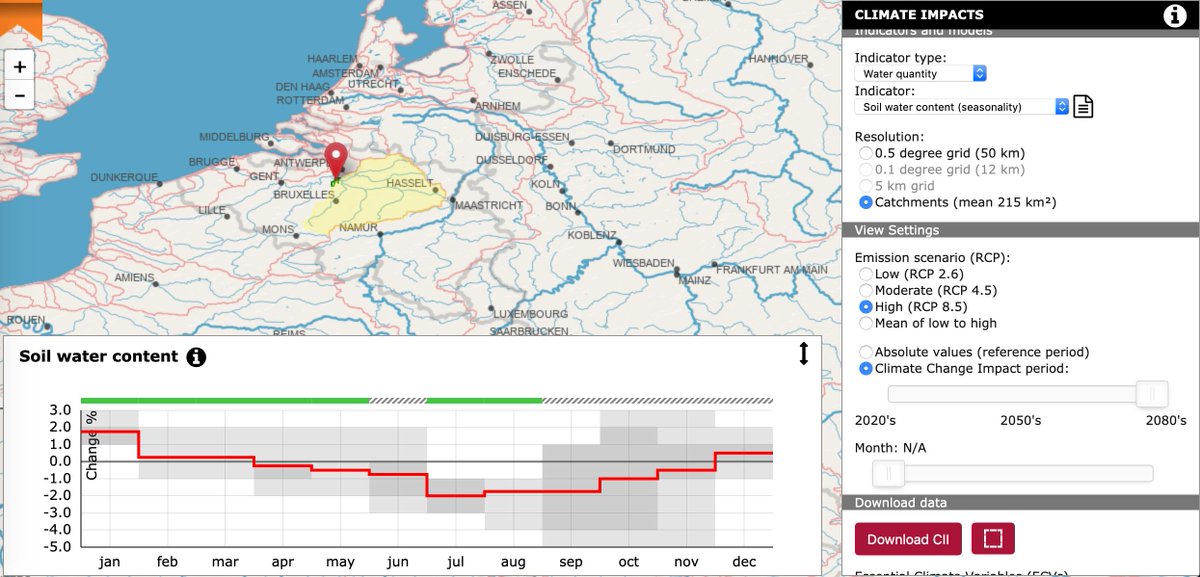
For the @auvergnerhalpes water catchment area, a decreasing soil water content in a high emission scenario (#RCP 8.5) can be observed as well [both for 2050 and 2080] @Hydro_research
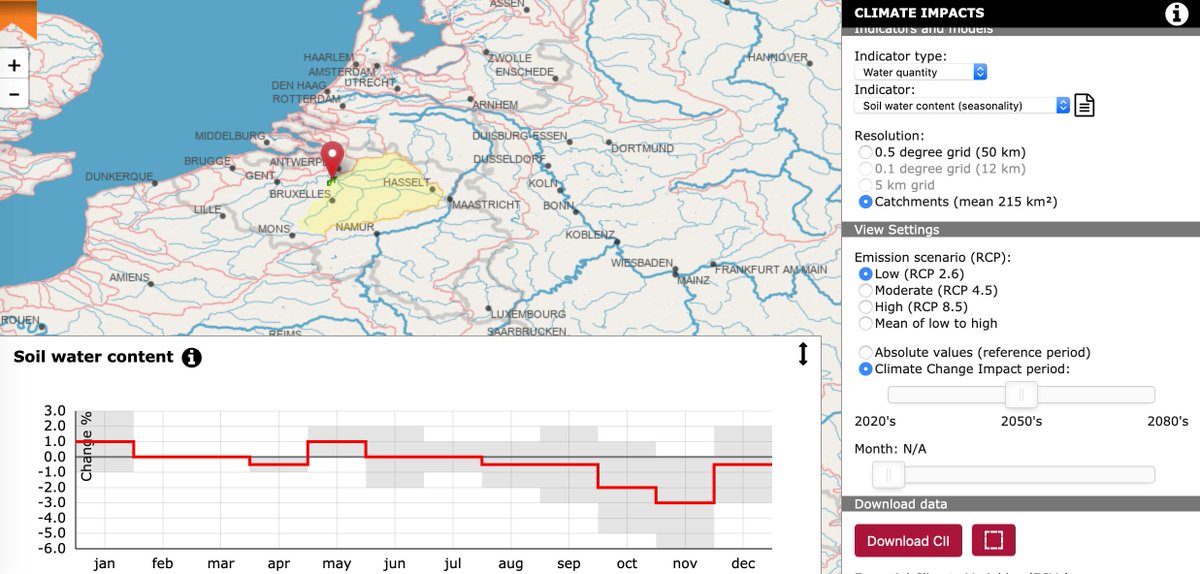
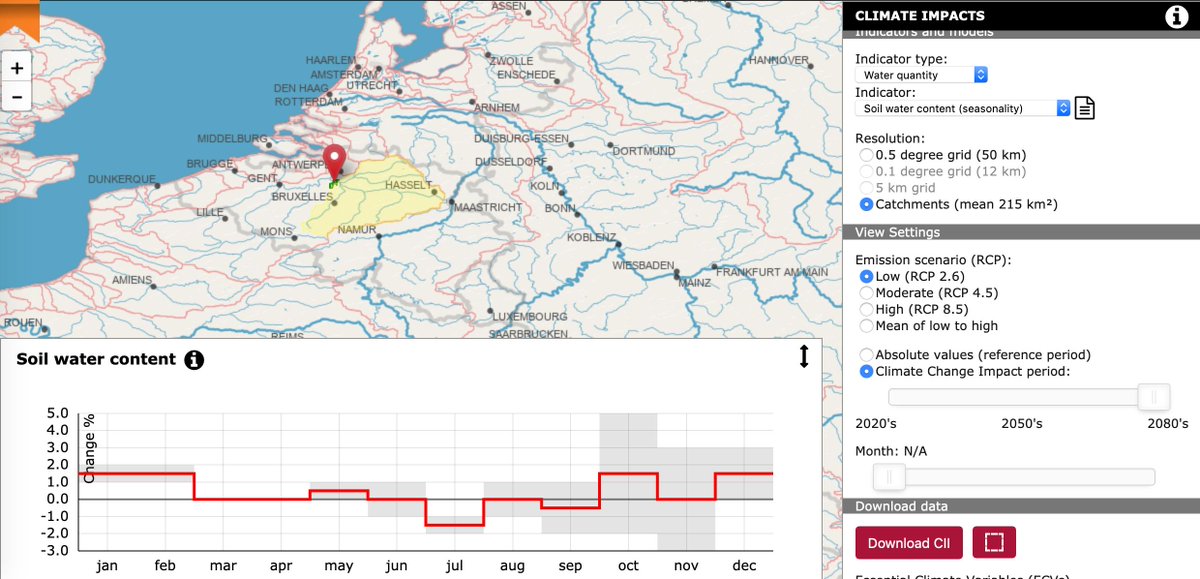
In Flanders, the effect of future emissions on soil water content is less outspoken according to @CopernicusECMWF ensembles, although also indicating lower soil water content - specifically during summer - in a high emission scenario (2080) @klimaat_be @DOVdovVO @MarjoVanoppen
@threadreaderapp unroll