
,
31 tweets,
7 min read
Read on Twitter
Done with G and ready for E! I'll try to tweet a bit more this talk. My fingers were too busy coding this morning... #SER2019 

Starting off with a brief history of sensitivity analyses, bounds for effects and the cornfield conditions (how strong associations between U and A, later U and Y) would have to be to completely explain away the observed RR relating A any Y)
And now the classic picture of Fisher smoking a pipe emerges...

Now reviewing pros and cons of existing techniques (e.g. Cornfield Bross, Schlesselman, Rosenbaum and Rubin, Imbens) "Techniques are sometimes criticized because they make assumptions to assess assumptions!"
Param 1: Max. effect that U could have on Y on the risk ratio scale (in exposed or unexposed), whichever is greater. Param 2: What is the prob. that U takes value 1 (2, 3,... ), compare exposed vs. unexposed)- take max. of these ratios (generalizations to allow for non-binary U)

And multiple U's, actually...
The bias might not be this large; this is the max. bias that could be achieved. Esp. if unmeasured confounder is rare.

Important: RRs that go into formula must be >1 (so take inverse of protective effects)
The Cornfield conditions essentially assume the other parameter is infinite- conservative in the other parameter.

Big challenge: which parameters to choose for "subjective" sensitivity analysis techniques? Tyler VanderWeele promises E-value approaches are move objective- focusing on 'explaining away' #ser2019
"E-value is thus a measure pertaining to Evidence for causality" . E value = RR + sqrt[RR*(RR-1)]. Answers question of: 'How big would confounding have to explain away observed estimate?'
Tyler: "E-val can include a set of U's, but we have to take into account whether particular RR parameters for the set of U's is plausible or not. In general, if more than 1-2 important unmeas. confounders, will be tough to draw reliable concl (generates bias) - for @baumeister_se
Worked example w/ interpretation

"Easy to put in your papers... Pretty much just copy and paste this text and change the numbers and you're done" :D
"In any observational study, you should do some sens. analysis, and E-value approach is straightforward and simple, let's you easily do the absolute minimum."
"Modest E-value doesn't mean an effect is not there, but we cannot say evidence is definitive"

E-vals always relative to (1) outcome under study, (2) exposure under study, (3) set of confounding variables (so most relevant in context of a single specific study and not really for comparing btwn. studies).
Some discussions about whether E val for confidence limits appropriate or not (in context about NHST). Tyler thinks it's important to also quantify uncertainty in precision and not just effect size (E val for confidence interval)
Important clarification: E val for 95%CI not same as 95% CI for E val (the latter would make use of delta method, could be useful if thinking about the size of a hypothetical obs. study that would be needed- or if never really feasible)

E and P can go in different directions. E value will converge with increasing sample size (unlike P values, 'design sensitivity')

Someone DM'ed for the paper: doi: 10.7326/M16-2607 (2017 Ann Int Med)
A more recent one in JAMA ncbi.nlm.nih.gov/pubmed/30676631 and a correcting misconceptions article in Annals: ncbi.nlm.nih.gov/pubmed/30597489
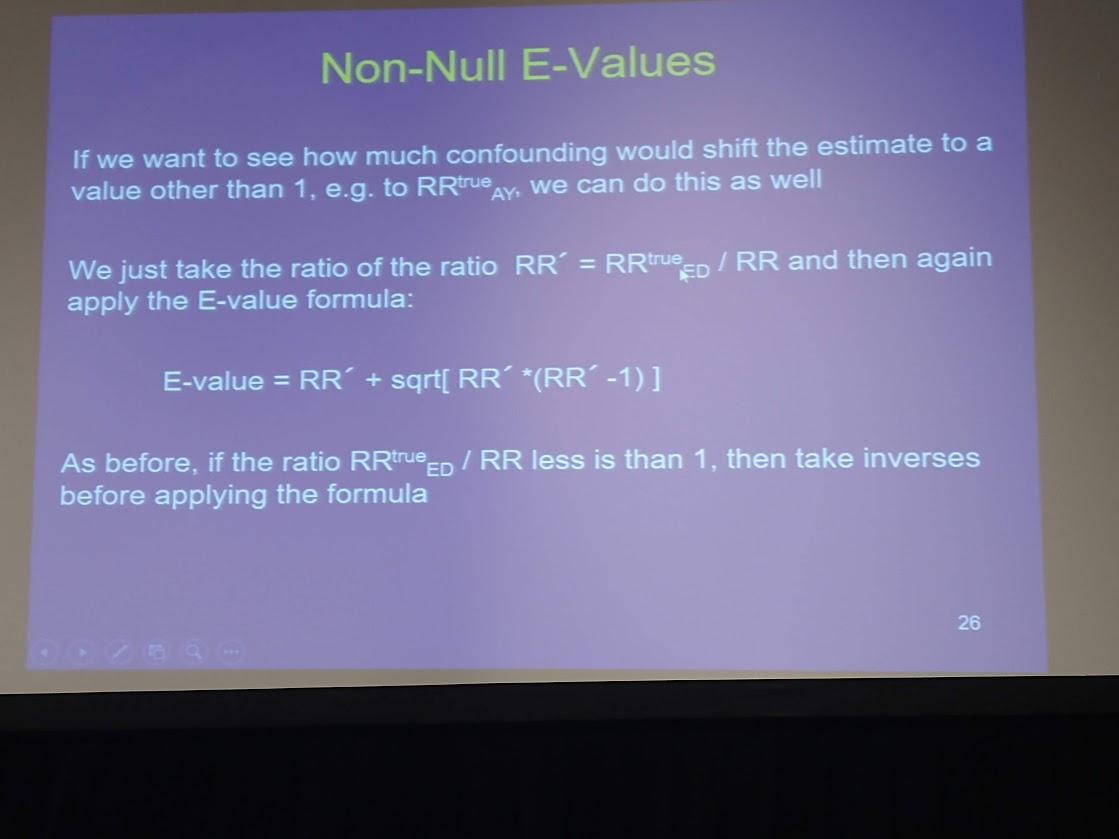
Also important: E vals can't be used in same way to provide evidence for 'no effect'. Absence of evidence is not the same as evidence of absence. (Not unfamiliar...) However, one can calculate non-null E-values (how much conf. needed to move est. to any other value).

Depending on context, question, setting, etc. these may be more useful...
Q comes up about rel. prevalences of exposures and confounders (coming back to this later- this is a central limitation of E val).
As usual, ORs calculated with common outcomes are annoying and are inflated estimates of risk ratios; approx. transformation can be used to calc. E vals

Approx. E vals can be obtained for differences in continuous outcomes (Use approx. RR = exp(0.91xd), where d is standardized effect size (outcome var divided by its standard deviation).
Made very easy to use, so can readily be incorporated as 1 sentence in methods, results, discussion... even an easy online tool: evalue-calculator.com

Tyler emphasizes he is not arguing against other more detailed sens. analyses, but leaves researchers without an excuse for doing something to check robustness of their estimates
"Too many of our interpretative practices for obs. studies are inherited from RCTs. The E-val approach corrects this; it is easy to use and is applicable with most effect measures"


