,
37 tweets,
10 min read
Read on Twitter
This morning, Opta - the football analytics company - released a 2018/19 Championship season review. I'm going to parse all of the relevant #lufc data here but if you want to read the review yourself, you can find it here:
optasportspro.com/static/10-crea…
optasportspro.com/static/10-crea…
First things first: let's look at the team.
One of the most pervasive metrics in football analytics at the moment is Expected Goals (xG). If you don't know what Expected Goals are, here's the Opta definition:
One of the most pervasive metrics in football analytics at the moment is Expected Goals (xG). If you don't know what Expected Goals are, here's the Opta definition:
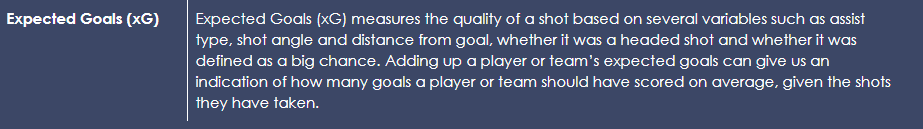
Essentially, xG models use (often quite complicated) algorithms to assign a value to chances taken by a football team. These values on a scale from 0 (impossible to score) to 1.0 (impossible to miss). If you add these up, you can determine how many goals a team would be likely to
score within a certain time frame (the larger the time frame, the better - as a general rule).
As you can see from these graphics, Leeds fans can be feeling disappointed that their team didn't achieve promotion last season. They topped both the table for xG for (how many they
As you can see from these graphics, Leeds fans can be feeling disappointed that their team didn't achieve promotion last season. They topped both the table for xG for (how many they
might expect to have score in the course of the season) and xG against (how many they might expect to concede in the course of the season).


Breaking these figures down, you can see from this graphic that Leeds took the most shots from open play and almost matched Norwich's open play xG (the highest in the league). However, tellingly, Leeds performed their xG value by a couple of goals where Norwich and Sheffield

United overperformed their's: Norwich by a huge amount.
This could suggest that Norwich were very lucky and that Leeds were slightly unlucky but there are other factors to consider here (of which more later).
This could suggest that Norwich were very lucky and that Leeds were slightly unlucky but there are other factors to consider here (of which more later).
At the other end of the field, a similar picture emerges: Leeds were up there with the best in the league in terms of xG against. They had the lowest xG against in the league and conceded the fewest shots. However, once again, they underperformed these figures by about 8 goals.

Norwich also underperformed to their xG against figure but only by about 4.5 goals and Sheffield United overperformed by 1.5 goals.
It isn't hard to see that, between xG for and xG against, Leeds came off the worst of their two championship rivals.
It isn't hard to see that, between xG for and xG against, Leeds came off the worst of their two championship rivals.
If you start to break down Leeds in the attacking phase, you get the following figures:

In each attacking phase, you can see that the top three are all very comparable again but with Leeds being the more direct team per speed.
You can also break attacking sequences into game state (whether we were winning, losing or drawing) or location (whether home or away)
You can also break attacking sequences into game state (whether we were winning, losing or drawing) or location (whether home or away)

There's not too much to see here other than that we were stylistically very similar in the attacking phase regardless of whether we were home or away. You can also see that we tended to speed up the attacking phase when we were losing which is only natural.
In the defensive phase, Leeds show up really interestingly:

Unsurprisingly, we show up as the team with the highest number of high pressures: that is putting pressure on the ball further up the pitch.
PPDA stands for Pressures per Defensive Action. This is the number of opposition passes allowed outside of the pressing team’s own
PPDA stands for Pressures per Defensive Action. This is the number of opposition passes allowed outside of the pressing team’s own
defensive third, divided by the number of defensive actions by the pressing team outside of their own defensive third. A lower figure indicates a higher level of pressing, while a higher figure indicates a lower level of pressing.
Leeds have the lowest figure in the league.
Leeds have the lowest figure in the league.
Start distance indicates the distance in metres from their own goal that a team begins their defensive pressure. Leeds have the highest figure again indicating their pressing begins very high up the pitch.
Again unsurprisingly, Leeds made more defensive pressures than any other
Again unsurprisingly, Leeds made more defensive pressures than any other

team in the top half of the table.
Altogether, Leeds enacted a high and energetic press which functioned well in keeping opposition chances to a minimum. They were unlucky to concede as many goals as they did.
Altogether, Leeds enacted a high and energetic press which functioned well in keeping opposition chances to a minimum. They were unlucky to concede as many goals as they did.
Turning to the players and OH LOOK... it's only Patrick Bamford at the top of the individual xG chart...

No need to flog a dead horse. His xG was 0.8 per 90 minutes. That is very good. Taking into account where he hit the shots he took (xGOT) his finesse was clearly off last season. His 0.6 goals per 90, though, was pretty much what you'd expect in line with this figure.
Kemar Roofe similarly underperformed xG (are you seeing a pattern here?)
When you look at players like Tammy Abraham, Teemu Puuki and Billy (*grinds teeth*) Sharp, you'll see that all of them overperformed per xG.
When you look at players like Tammy Abraham, Teemu Puuki and Billy (*grinds teeth*) Sharp, you'll see that all of them overperformed per xG.
For those of you who can bear it... here's Bamford's shot chart from last season. The size of the dot correlates to the likelihood of scoring - the bigger the dot, the better the chance. This makes for grim reading.

Looking under the surface at Bamford and Roofe, Opta give you pressure and clarity data on top of the xG data:

Pressure indicates how much coverage you're getting from opposition defenders. Clarity indicates your line of site to the goal.
Bamford, worryingly, had one of the highest figures of low-pressure shots in the league. However, he had a tendency to take shots with lower clarity.
Bamford, worryingly, had one of the highest figures of low-pressure shots in the league. However, he had a tendency to take shots with lower clarity.
This shot map from Kemar Roofe should make you feel better though.

Looking at the Exected Assists (xA) data, it's a different story.
Here's the Opta definition of xA:
Here's the Opta definition of xA:

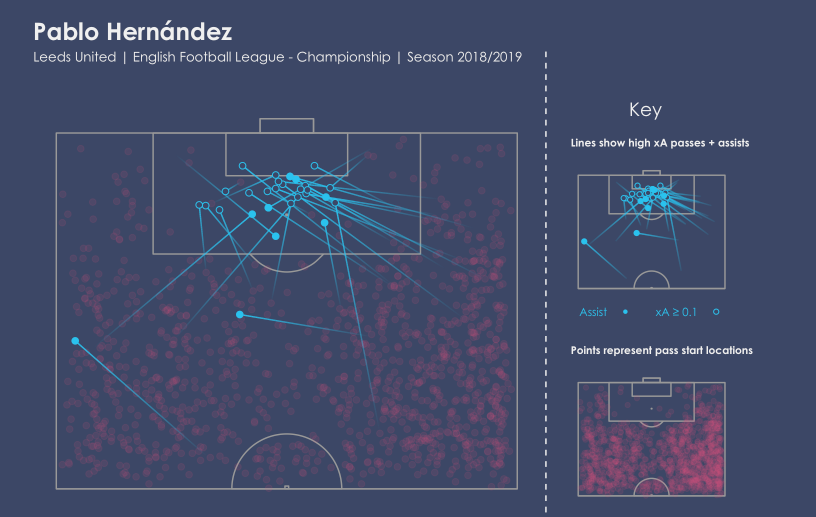
Oh but this is weird: Samu Saiz is top of the list... closely followed by Pablo Hernandez....
Do you think that could have affected our season at all?
Do you think that could have affected our season at all?

Both Saiz and Hernandez have good per 90 figures. Interestingly, though, they drop a little per 100 passes which probably indicates that their roles weren't primarily directly creative.
Here's a nice graphic of Pablo's involvement assist-wise last season:
Here's a nice graphic of Pablo's involvement assist-wise last season:
Goalkeepers: Not a lot to say. Bailey Peacock-Farrell benefitted from being on a good side but didn't do much to stop goals going in when they came.


Guys, we're really good defensively. Here's a chart looking at the best players in the league in the defensive phase. Our two CBs (PJ sad face) and our DM picking up 1, 2 and 3.

As you can see, both Liam Cooper and Pontus Jansson were involved both in ball-winning and passing-sequence starts. Kalvin Phillips, it might surprise you to note, is not a particularly outstanding tackler in terms of volume but he is exceptional at picking up loose balls.
When it comes to attacking phase involvements, things are a little less sanguine. Patrick Bamford just about creeps into the list but his figures are less than healthy. He's been involved in a few sequences that end in shots (20.64 per hundred sequences) but only 2.52 of these

resulted in a goal.
When it comes to build up sequences (that is goal ending sequences with key passes and shots removed) things get even worse - not a single Leeds player to be seen (and a LOT of Norwich players).
When it comes to build up sequences (that is goal ending sequences with key passes and shots removed) things get even worse - not a single Leeds player to be seen (and a LOT of Norwich players).

So what have we learned from the Opta Championship Review from last season?
Probably not a lot that we didn't already know. Leeds were unlucky not to go up based on their xG figures. The reason why they underperformed had a lot to do with misfiring strikers. But there is a lot
Probably not a lot that we didn't already know. Leeds were unlucky not to go up based on their xG figures. The reason why they underperformed had a lot to do with misfiring strikers. But there is a lot
to look forward to going forward with Marcelo Bielsa at the helm. The style of football that Leeds play is progressive, exciting and productive. Even with key players leaving this summer, it's clear that Bielsa can squeeze value out of a flabby squad. Bring on 19/20.
Of course, it should be said that both of these two metrics (xG chain and xG build-up as they are often called) are controversial and often inconclusive. In any case, the fact that Leeds players don't show up in the data could just mean that the production of chances is shared
around the squad more.
CORRECTION: PPDA stands for Passes (allowed) per Defensive Action - my mistake!