1/ Time Series Momentum (Moskowitz, Ooi, Pedersen)
"A diversified portfolio of time series momentum strategies across asset classes delivers abnormal returns with little exposure to standard asset pricing factors & performs best during extreme markets."
papers.ssrn.com/sol3/papers.cf…
"A diversified portfolio of time series momentum strategies across asset classes delivers abnormal returns with little exposure to standard asset pricing factors & performs best during extreme markets."
papers.ssrn.com/sol3/papers.cf…

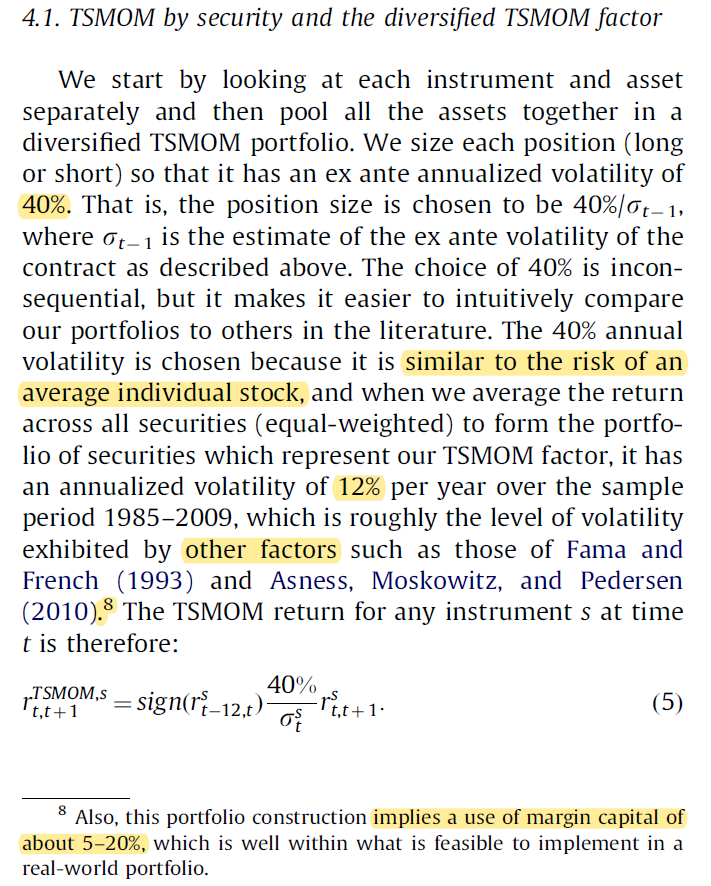
2/ The authors use liquid futures and inverse volatility weight the positions due to large variations in the contracts' volatilities.
Passively rolling the most liquid contracts tends to generate positive returns. Net speculator long positions also tend to be positive.
Passively rolling the most liquid contracts tends to generate positive returns. Net speculator long positions also tend to be positive.


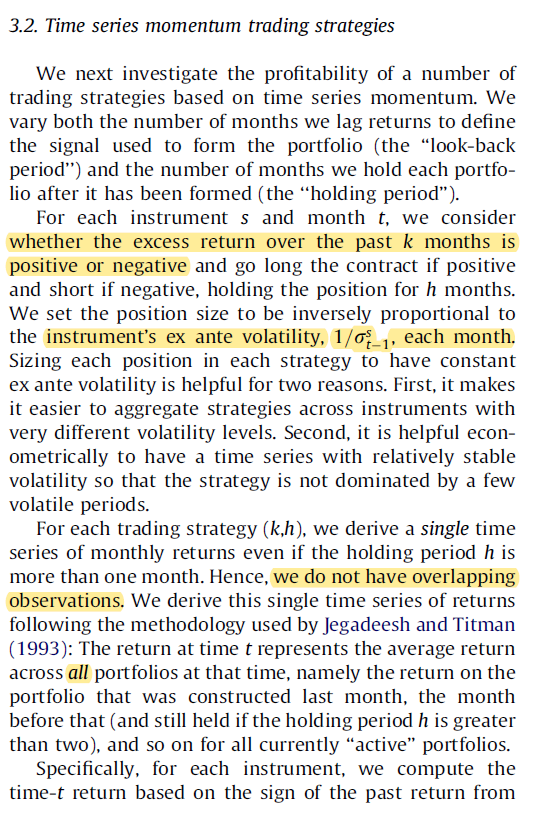
3/ Return autocorrelation (trends) tend to exist whether returns are viewed using return/volatility or on the sign of excess return (positive or negative only).
Horizons longer than a year (years 2, 3, 4, and 5) tend to show long-term reversals.
Horizons longer than a year (years 2, 3, 4, and 5) tend to show long-term reversals.


4/ Table 2 shows the t-stats of the alphas of a strategy that goes L/S based on the sign of excess returns.
Shorter formation periods favor longer holding periods and vice versa (possibly because trends last only a year, though this is not explicitly discussed in the paper).
Shorter formation periods favor longer holding periods and vice versa (possibly because trends last only a year, though this is not explicitly discussed in the paper).


5/ D’Souza, Srichanachaichok, Wang, and Yao found a similar relationship between formation and holding periods when they tested time-series momentum on individual stocks.
(They also found that much of its benefit comes from the inverse vol weighting.)
(They also found that much of its benefit comes from the inverse vol weighting.)
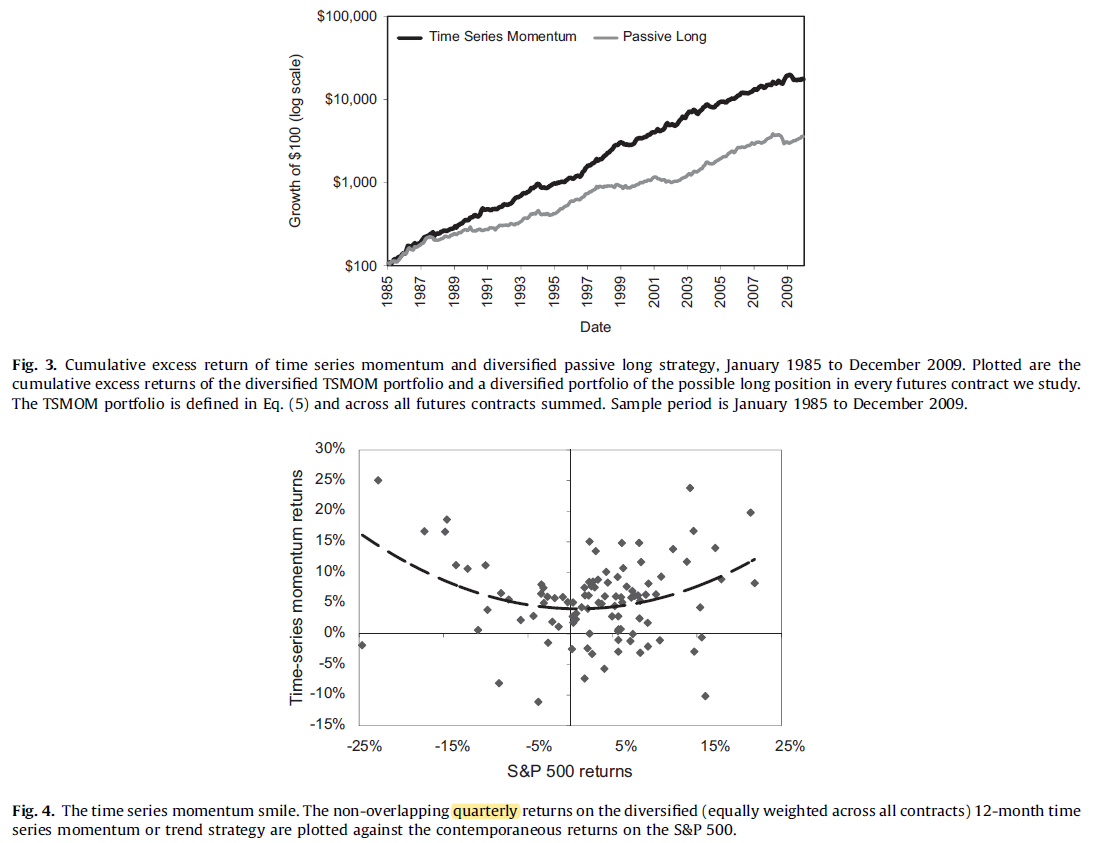
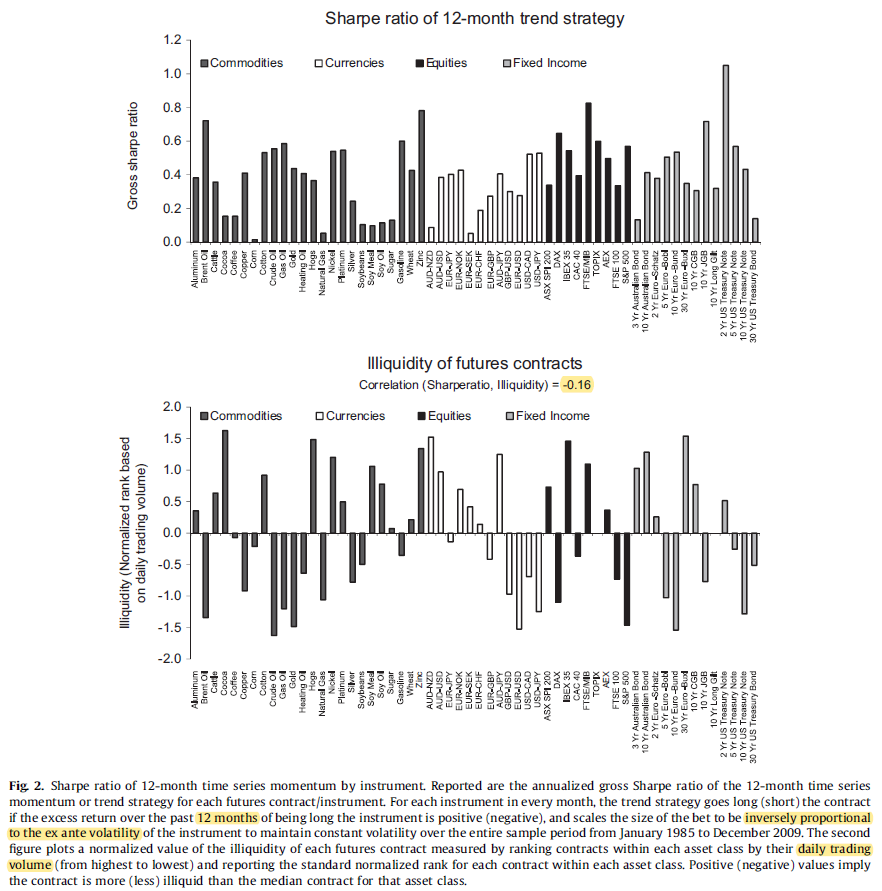
6/ TSMOM (the 12-month formation, 1-month holding version) has a positive Sharpe ratio in every futures contract (1985-2009).
"If we regress the TSMOM strategy for each security on the strategy of always being long, we get a positive alpha in 90% of the cases."
"If we regress the TSMOM strategy for each security on the strategy of always being long, we get a positive alpha in 90% of the cases."


7/ The 2009 end date for the sample is rather favorable for the strategy. AQR subsequently examined the performance of the strategy out of sample (both to 2017 and using futures contracts that hadn't been tested before):
8/ Interestingly, TSMOM loads on UMD, even though UMD uses a different set of instruments (individual U.S. stocks rather than futures contracts).
It also loads positively on "MOM everywhere" and, perhaps surprisingly, "VAL everywhere."
It survives with stat. significant alpha.
It also loads positively on "MOM everywhere" and, perhaps surprisingly, "VAL everywhere."
It survives with stat. significant alpha.
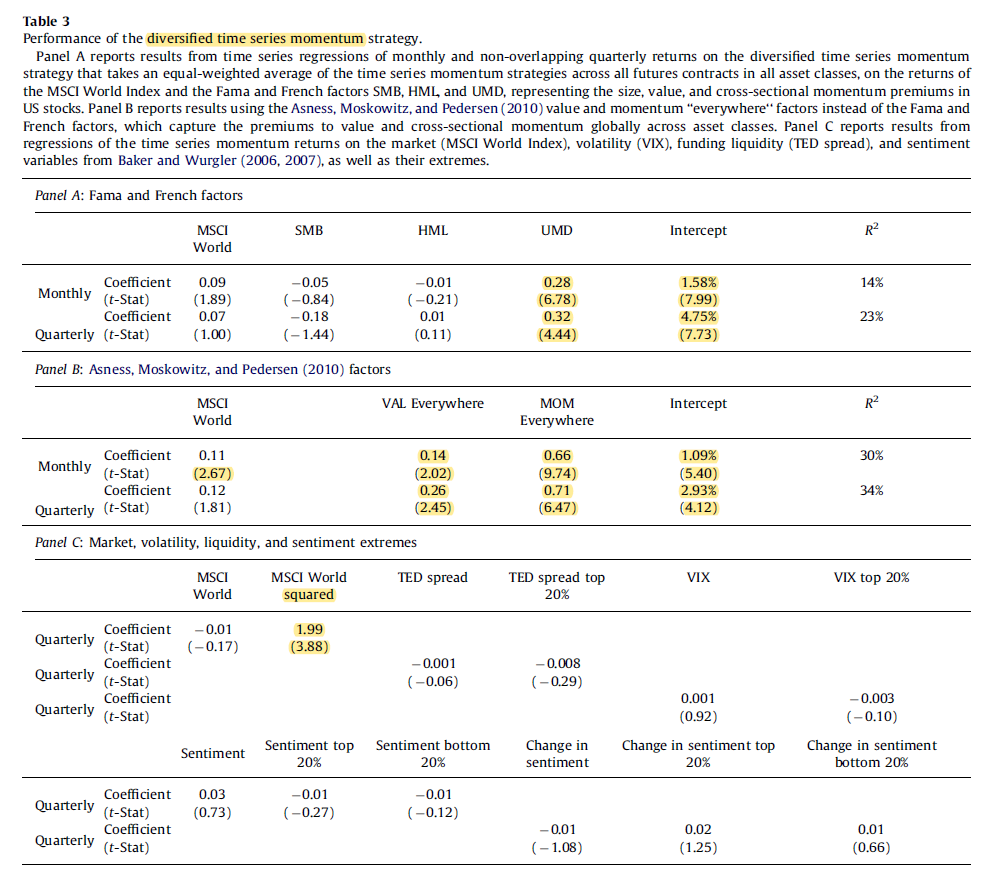

9/ There's also a small positive loading on MSCI World that's mostly not stat. significant.
Goyal and Jegadeesh break down TS mom into cross-sectional, market timing, and long-term net exposures. (The third could make TS mom long-term net long stocks.)
Goyal and Jegadeesh break down TS mom into cross-sectional, market timing, and long-term net exposures. (The third could make TS mom long-term net long stocks.)
10/ "While the beta on the market itself is insignificant, the coefficient on the market return *squared* is significantly positive, indicating that TSMOM delivers its highest profits during the most extreme market episodes.
"...not likely to be compensation for crash risk."
"...not likely to be compensation for crash risk."


11/ Interestingly, Sharpe ratios don't seem to have a strong relationship with the liquidities of the futures contracts (as measured by a snapshot of daily volume in June 2010).
The TED spread, VIX, and sentiment don't seem to be significantly related to TSMOM returns, either.
The TED spread, VIX, and sentiment don't seem to be significantly related to TSMOM returns, either.

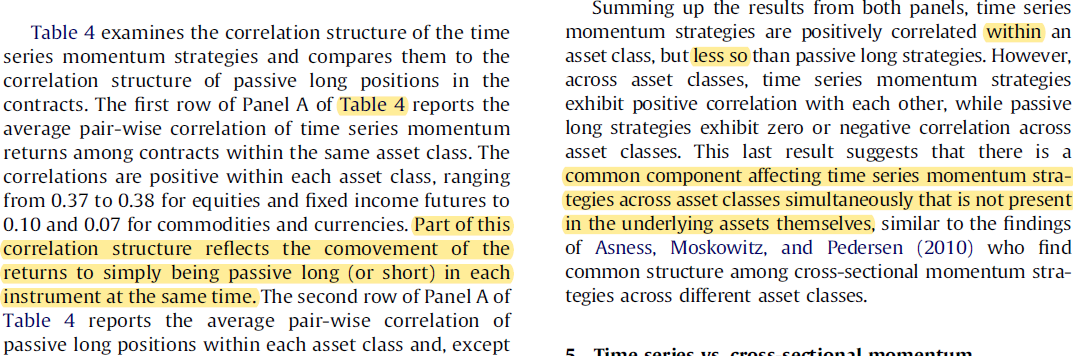
12/ "TSMOM strategies are positively correlated within an asset class, but less so than passive long strategies. However, across asset classes, TSMOM strategies exhibit positive correlation with each other, while passive long strategies exhibit zero or negative correlation."

13/ Goyal and Jegadeesh specifically explore the long-term net long exposure of time series momentum in various asset classes, which may explain the positive correlations of TSMOM returns with those of a passive long portfolio:
14/ TSMOM and cross-sectional momentum (XSMOM) may have similar return drivers.
TSMOM survives controlling for XSMOM, even when XSMOM for U.S. stocks is included (which uses a completely different set of instruments.)
TSMOM subsumes UMD and XMOM, but HML survives.
TSMOM survives controlling for XSMOM, even when XSMOM for U.S. stocks is included (which uses a completely different set of instruments.)
TSMOM subsumes UMD and XMOM, but HML survives.

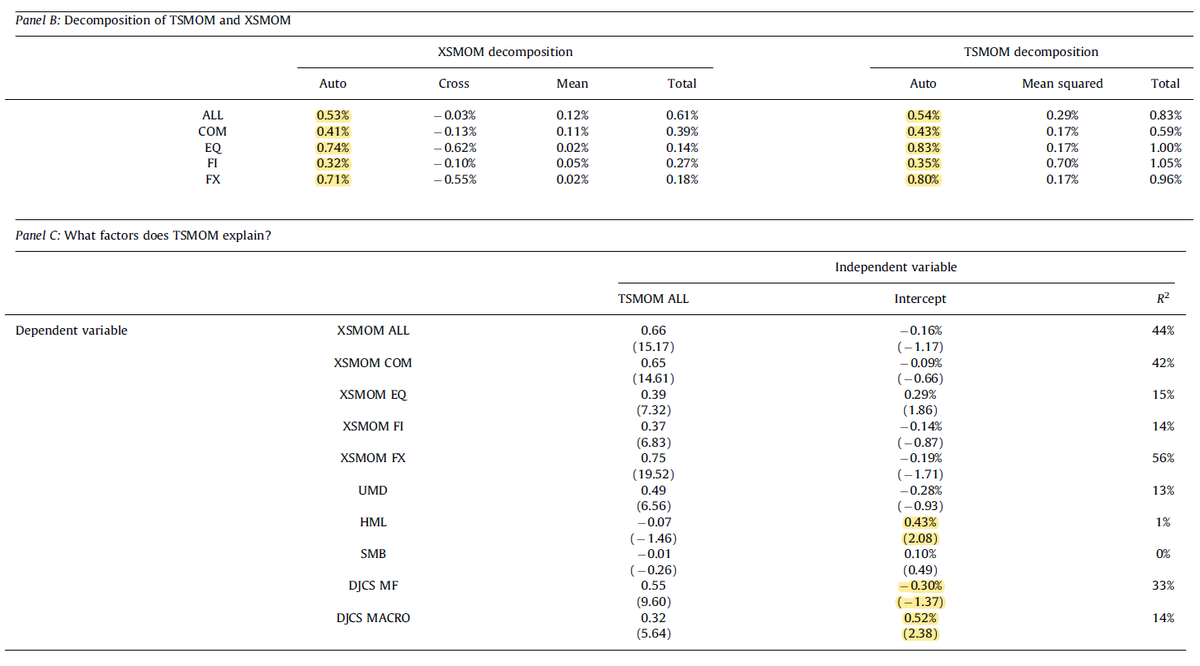

15/ Note: Goyal and Jegadeesh found that TS and XS momentum perform similarly after accounting for market timing (time-varying and long-term static net long exposures) and inverse vol weighting, though TS still had better tail metrics in their paper.
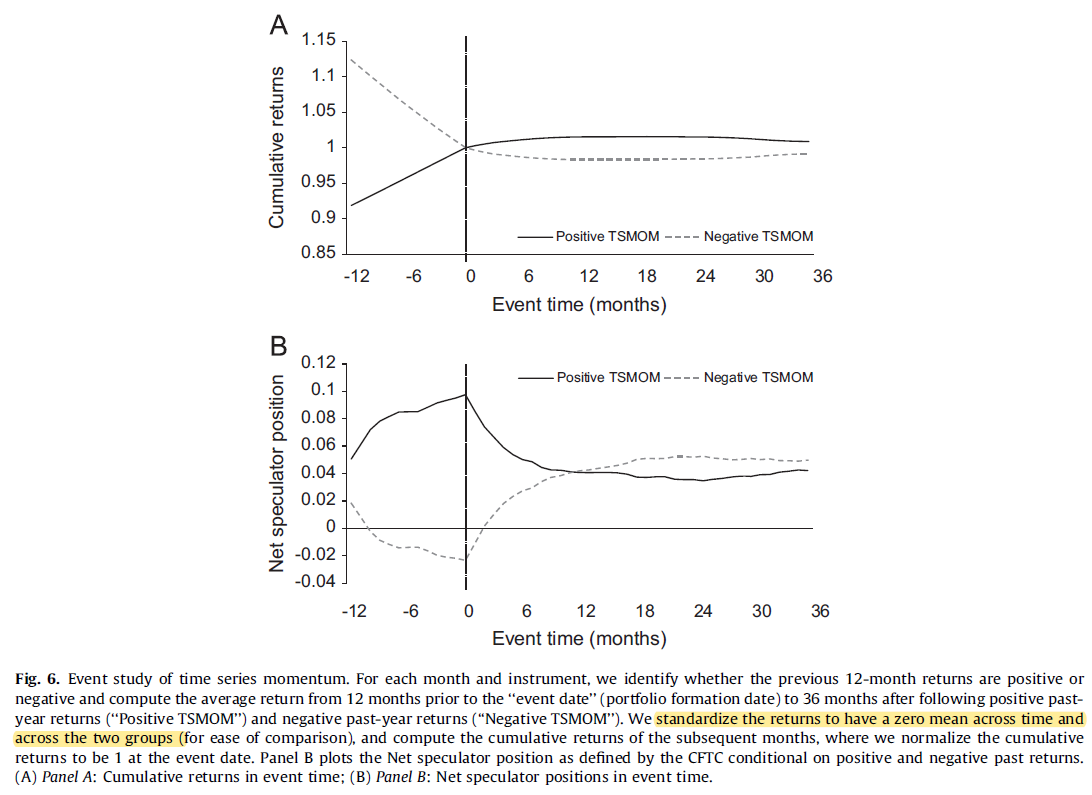
16/ "For positive TSMOM, speculators increase their positions steadily from months -12 to 0.... After the event date, speculators' positions begin to mean-revert.
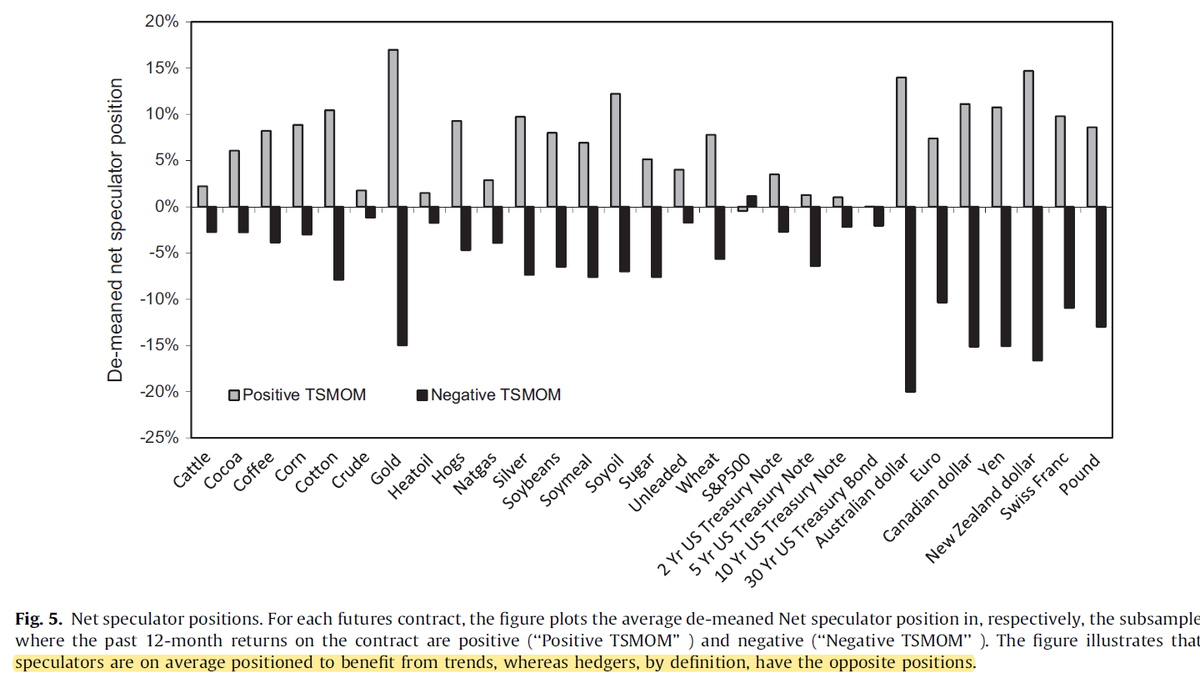
"Speculators are, on average, positioned to benefit from trends, whereas hedgers have opposite positions."
"Speculators are, on average, positioned to benefit from trends, whereas hedgers have opposite positions."
17/ After a one-SD shock to the total returns on the futures contract,
*spot* prices show the typical trend-and-mean-reversion pattern,
but the *roll* return does not reverse (hedging pressure?).
Controlling for this weakens the explanatory power of net speculator positions.
*spot* prices show the typical trend-and-mean-reversion pattern,
but the *roll* return does not reverse (hedging pressure?).
Controlling for this weakens the explanatory power of net speculator positions.