QCOM 2/5
QCOM 3/5
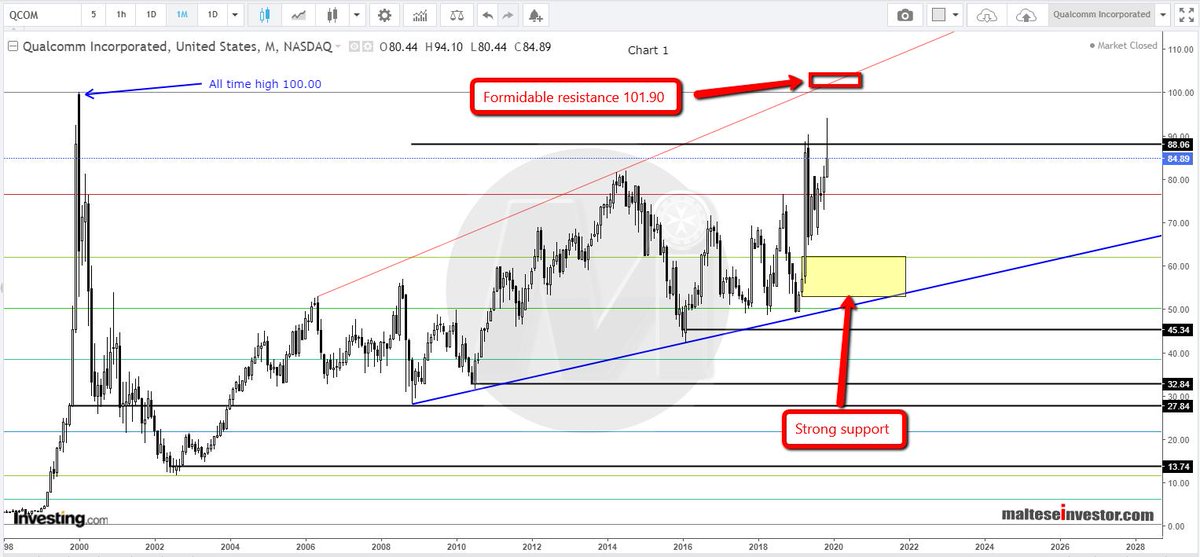
Monthly Chart: Resistances at the all time high (100) and 101.90 (sloping #trendline) are formidable and selling pressure is expected to be seen at those levels. The strong support area is between 61.00-52.00
QCOM 4/5
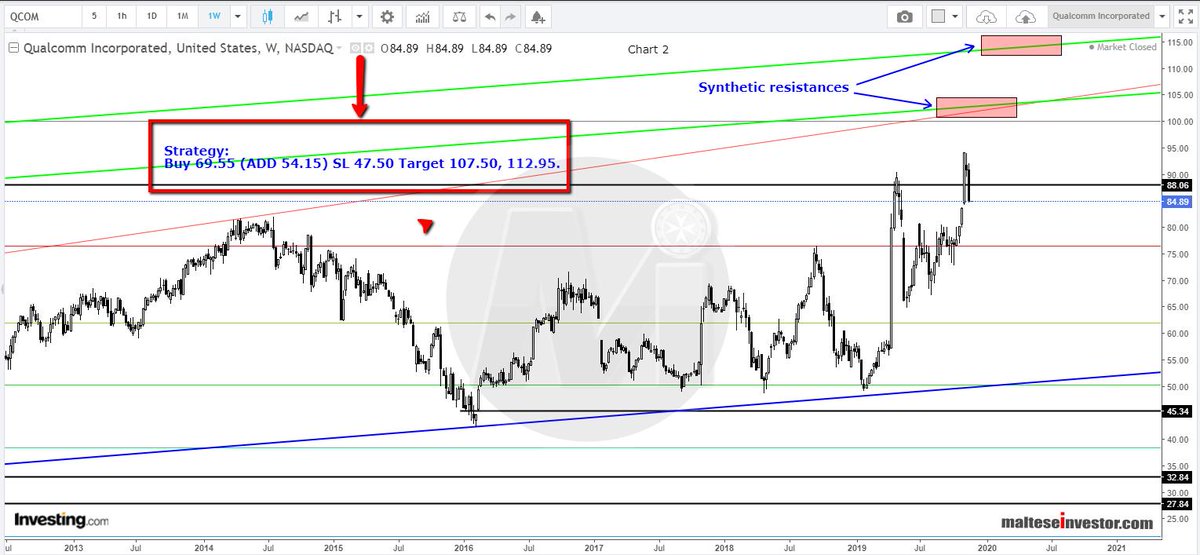
Weekly Chart: Synthetic trendline #resistances can be seen at 105 and 113.50-115.80.
The #Strategy is printed on the image.
$QCOM 5/5
