THREAD
Key findings from the IPCC Special Report on the Ocean and the Cryosphere in a changing climate were presented at #COP25 this week
unfccc-cop25.streamworld.de/webcast/joint-…
Key findings from the IPCC Special Report on the Ocean and the Cryosphere in a changing climate were presented at #COP25 this week
unfccc-cop25.streamworld.de/webcast/joint-…
This series of tweets is my presentation, if you'd rather read than watch the video. I'll cover the parts related to observed and projected changes in polar regions, ocean and sea level rise. 

My fellow co-chairs have covered the parts related to high mountain cryosphere, marine life, challenges, strengthening response options and enabling conditions.


Let's first focus on the state of scientific knowledge related to polar regions in a changing climate.

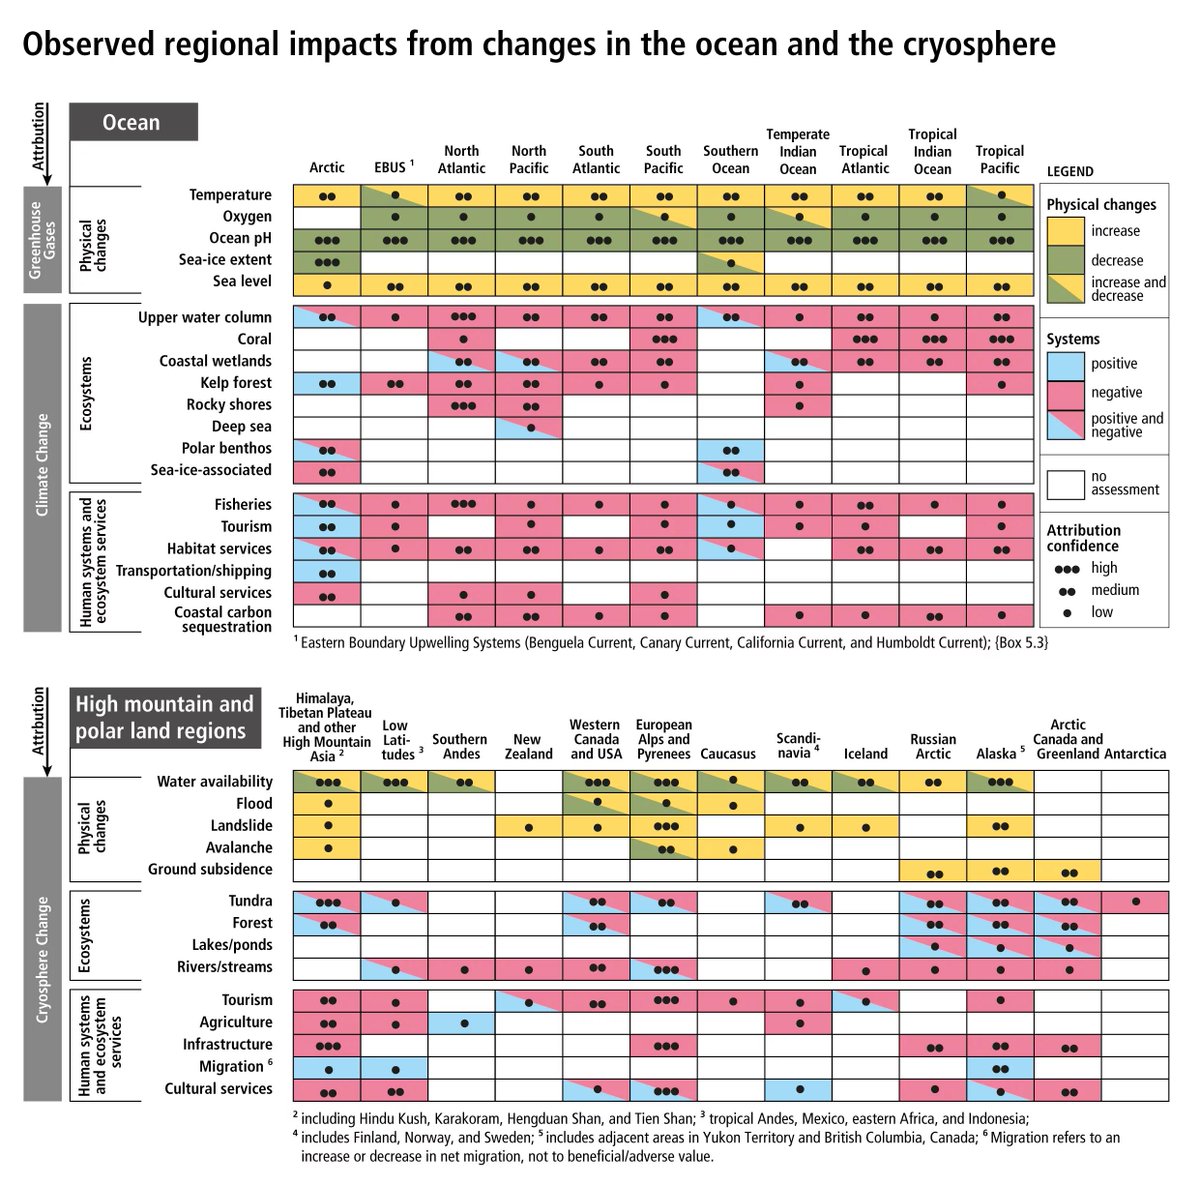
The polar regions are losing ice, and their oceans are changing rapidly. The consequences of this polar transition extend to the whole planet, and are affecting people in multiple ways.
Polar regions encompass around 20% of the global ocean surface, land areas with the most persistent snow cover, more than 90% of the frozen ground area, the permafrost, 70% of the total glacier area, as well as the Greenland and Antarctic ice sheets.

Polar processes and feedbacks have played and will play a key role in the global ocean circulation, the global energy and carbon cycles, and global sea level changes.
This is a schematic representation of the key features and mechanisms by which the cryosphere and ocean in the polar regions influence climate, ecological and social systems in these regions and across the globe.
Multiple and diverse perspectives encompass the polar regions as source of resources, a key part of the global climate system, a place for preserving marine and terrestrial ecosystems and unique biodiversity, a place for international cooperation, and, importantly a homeland.
Around four million people live in the Arctic, of whom 10% are indigenous. This report has incorporated published indigenous knowledge and local knowledge for assessing climate change impacts and responses.
Over the last decades, global warming has led to widespread shrinking of the polar cryosphere, with mass loss from ice sheets and glaciers, reductions in Arctic snow cover and Arctic sea ice extent and increased permafrost temperature
Let's first focus on observed and projected sea ice changes.
Arctic sea ice extent has decreased for all months of the year.

September sea ice reductions are around 13% per decade since 1979.
These changes are unprecedented for at least 1000 years.
Arctic sea ice has also thinned, and since 1979 the areal proportion of multi-year ice (at least five years old) has declined by approximately 90%.
Approximately half this Arctic sea ice loss is attributable to increased atmospheric greenhouse gas concentrations
Changes in Arctic sea ice have the potential to influence mid-latitude weather, but there is low confidence in the detection of this influence for specific weather types.
Summertime Arctic ship-based transportation (including tourism) increased over the past two decades concurrent with sea ice reductions.
This has implications for global trade and economies linked to traditional shipping corridors, and poses risks to Arctic marine ecosystems and coastal communities, such as from invasive species and local pollution
Arctic sea ice loss is projected to continue through mid-century, with differences thereafter depending on the magnitude of global warming :
•If global warming is stabilized at 1.5°C above pre-industrial levels, the Arctic ocean would only be ice-free in September – the month with the least ice – once in every hundred years.
•For global warming of 2°C, this would occur one year in ten up to one year in three.
Hans-Otto Pörtner will cover the implications for marine life in the next presentation.
Let me mention briefly the state of knowledge related to Antarctic sea ice before moving to the terrestrial cryosphere.
The Antarctic sea ice cover exhibits no significant trend over the period of satellite observations (1979–2018).
There is currently limited evidence and low agreement concerning causes of the strong recent decrease (2016–2018), and low confidence in projections for Antarctic sea ice.
Let's now move to permafrost.
See the Glossary for definitions of key scientific terms: ipcc.ch/site/assets/up…
See the Glossary for definitions of key scientific terms: ipcc.ch/site/assets/up…

Permafrost temperatures in the Arctic have continued to increase, by 0.39°C in 2007–2016, reaching record high levels.

Widespread permafrost thaw is projected for this century.
Even if global warming is limited to well below 2°C, around one quarter of the near-surface (3-4 meter depth) permafrost area will thaw by 2100. If greenhouse gas emissions continue to increase strongly, around 70% near-surface permafrost could be lost by 2100.
Arctic and boreal permafrost contain around 1500 Gt (billion tons) organic carbon, almost twice the carbon in the atmosphere.
There is medium evidence with low agreement whether northern permafrost regions are currently releasing additional net methane and CO2 due to thaw
Methane contributes a small fraction of the total additional carbon release but is significant because of its higher warming potential.
Increased plant growth is projected to replenish soil carbon in part, but will not match carbon releases over the long term
Lower emissions scenarios dampen the response of carbon emissions from the permafrost region
Let's now move to Arctic terrestrial snow cover.
Arctic June snow cover extent on land declined by around 13% per decade since 1967, a total loss of approximately 2.5 million km2, predominantly due to warming

Feedbacks from the loss of summer sea ice and spring snow cover on land have contributed to amplified warming in the Arctic where surface air temperature increased by more than double the global average over the last two decades
Arctic autumn and spring snow cover are projected to decrease by 5–10%, relative to 1986–2005, in the near-term (2031–2050), followed by no further losses under a low emission pathway, but an additional 15–25% loss by the end of century under a high emission pathway.
For projected changes, this report mosty uses CMIP5 climate model projections using Representative Concentration Pathways (or RCPs).
RCPs are scenarios that include time series of emissions and concentrations of greenhouse gases and other human climate drivers. RCPs provide only one set of many possible scenarios that would lead to different levels of global warming
This report uses mainly RCP2.6 and RCP8.5 in its assessment, reflecting the available literature
RCP2.6 represents a low greenhouse gas emission, high mitigation future, that in CMIP5 simulations gives a two in three chance of limiting global warming to below 2°C by 2100
By contrast, RCP8.5 is a high greenhouse gas emission scenario in the absence of policies to combat climate change, leading to continued and sustained growth in atmospheric greenhouse gas concentrations.
Compared to the total set of RCPs, RCP8.5 corresponds to the pathway with the highest greenhouse gas
emissions.
emissions.
Other intermediate scenarios are used in the report but not shown here.

In the projection figures shown here, the blue curve represents model projections for RCP2.6, and the red curve the projections for RCP8.5.
In the Arctic, permafrost thaw and decrease in snow affect Arctic hydrology, wildfire, ecosystems, human activities and infrastructure

What is already experienced ?
Lake ice cover has also declined
Runoff into the Arctic Ocean increased for Eurasian and North American rivers since 1976
Increased wildfire and abrupt permafrost thaw, as well as changes in hydrology have altered the frequency and intensity of ecosystem disturbances.
There has been an overall greening of the tundra biome, but also browning in some regions of tundra and boreal forest, and changes in the abundance and distribution of animals including reindeer and salmon
Many species have altered seasonal activities especially in late winter and spring
Together, these changes impact access to (and food availability within) herding, hunting, fishing, forage and gathering areas, affecting the livelihood, health and cultural identity of residents including Indigenous peoples
Arctic residents, especially Indigenous peoples, have also adjusted the timing of activities to respond to changes in seasonality and safety of land, ice, and snow travel conditions.
Municipalities and industry are beginning to address infrastructure failures associated with flooding and thawing permafrost and some coastal communities have planned for relocation.
Limited funding, skills, capacity, and institutional support to engage meaningfully in planning processes have challenged adaptation
What is projected for the future?
Even as the overall regional water cycle intensifies, including increased precipitation, evapotranspiration, and river discharge to the Arctic Ocean, projected decreases in snow and permafrost may lead to soil drying with consequences for ecosystem productivity and disturbances.
Fire is projected to increase for the rest of this century across most tundra and boreal regions
On Arctic land, a loss of globally unique biodiversity is projected as limited refugia exist for some High-Arctic species and hence they are outcompeted by more temperate species.
Woody shrubs and trees are projected to expand to cover a quarter to half of today’s Arctic tundra area by 2050. The boreal forest is projected to expand at its northern edge, while diminishing at its southern edge where it is replaced by lower biomass woodland/shrublands.
About 20% of Arctic land permafrost is vulnerable to abrupt permafrost thaw and ground subsidence, which is expected to increase small lake area by over 50% by 2100 for RCP8.5
Disaster risks to human settlements and livelihood options in the Arctic are expected to increase, due to future changes in hazards such as unreliable ice and snow conditions, and increased exposure of people and infrastructure.
The majority of Arctic infrastructure is located in regions where permafrost thaw is projected to intensify by mid-century.
Retrofitting and redesigning infrastructure has the potential to halve the costs arising from permafrost thaw and related climate-change impacts by 2100
Let's now move to ice sheets.


Between 2006 and 2015, the Greenland Ice Sheet lost ice mass at an average rate of around 280 Gt/yr (billion tons per year; equivalent to around 0.8 mm/yr of global sea level rise), mostly due to surface melting.

In 2006–2015, the Antarctic Ice Sheet lost mass at an average rate of around 155 Gt/yr (equivalent to around 0.4 mm/yr of global sea level rise), mostly due to rapid thinning and retreat of major outlet glaciers draining the West Antarctic Ice Sheet
Mass loss from the Antarctic ice sheet over the period 2007–2016 tripled relative to 1997–2006. For Greenland, mass loss doubled over the same period
Acceleration of ice flow and retreat in Antarctica, which has the potential to lead to sea-level rise of several metres within a few centuries, is observed in the Amundsen Sea Embayment of West Antarctica and in Wilkes Land, East Antarctica.
These changes may be the onset of an irreversible ice sheet instability.


Uncertainty related to the onset of ice sheet instability arises from limited observations, inadequate model representation of ice sheet processes, and limited understanding of the complex interactions between the atmosphere, ocean and the ice sheet
The Greenland and Antarctic Ice Sheets are projected to lose mass at an increasing rate throughout the 21st century and beyond

The rates and magnitudes of these changes are projected to increase further in the second half of the 21st century in a high greenhouse gas emissions scenario
Strong reductions in greenhouse gas emissions in the coming decades are projected to reduce further changes after 2050
In 2100, the Greenland Ice Sheet’s projected contribution to global mean sea level rise is around 7 cm under RCP2.6, and around 15 cm under RCP8.5.
In 2100, the Antarctic Ice Sheet is projected to contribute around 4 cm under RCP2.6, and around 12 cm under RCP8.5.
The polar regions will be profoundly different in future compared with today, and the degree and nature of that difference will depend strongly on the rate and level of global warming. This will challenge adaptation responses regionally and worldwide, including for sea level rise

Small island developing states are home to 65 million people.
680 million people live in low-lying coastal zones today.
And they are exposed to sea level rise and coastal extreme events.
680 million people live in low-lying coastal zones today.
And they are exposed to sea level rise and coastal extreme events.

Let us first focus on observed global sea level rise.
Global mean sea level is rising, with acceleration in recent decades due to mass loss from the Greenland and Antarctic ice sheets, as well as continued glacier mass loss and ocean thermal expansion.

The rate of global mean sea level rise for 2006–2015 of 3.6 mm/year, is unprecedented over the last century and about 2.5 times the rate for 1901–1990 of 1.4 mm/yr (0.8– 2.0 mm/yr, very likely range).
Total global mean rise for 1902–2015 is 0.16 m (likely range 0.12–0.21 m).
The sum of ice sheet and glacier contributions over the period 2006–2015 (1.8 mm/year) is the dominant source of sea level, exceeding the effect of thermal expansion of ocean water which accounts for 1.4 mm/year of sea level rise.
The dominant cause of global mean sea level rise since 1970 is anthropogenic forcing (= past and current greenhouse gas emissions).
Sea-level rise is not globally uniform and varies regionally. Regional differences, within ±30% of the global mean sea-level rise, result from land ice loss and variations in ocean warming and circulation
Differences from the global mean can be greater in areas of rapid vertical land movement including from local human activities (e.g. extraction of groundwater)
Extreme wave heights, which contribute to extreme sea level events, coastal erosion and flooding, have increased in the Southern and North Atlantic Oceans by around 1 cm/yr since 1985. Sea ice loss in the Arctic has also increased wave heights since 1992.
Finally, anthropogenic climate change has increased observed precipitation, winds, and extreme sea level events, associated with some tropical cyclones, which has increased intensity of multiple extreme events and associated cascading impacts.
There is emerging evidence for an increase in annual global proportion of Category 4 or 5 tropical cyclones in recent decades
Let us now move to projected future sea level rise and extreme sea level events. Sea level is projected to continue to rise at an increasing rate.

The global mean sea level rise projected in 2100 under RCP26 is 0.43 m (0.29–0.59 m, likely range) above the 1986–2005 level.
For RCP8.5, the corresponding global mean sea level rise is 0.84 m (with a likely range from 0.61–1.10 m) in 2100.
Mean sea level rise projections are higher by 0.1 m compared to AR5 under RCP8.5 in 2100, and the likely range extends beyond 1 m in 2100 due to a larger projected ice loss from the Antarctic Ice Sheet.
The sea level rise range that needs to be considered for planning and implementing coastal responses depends on the risk tolerance of stakeholders.
(likely range = the assessed likelihood of an outcome lies within the 17-83% probability range)
Stakeholders with higher risk tolerance (e.g., those planning for investments that can be very easily adapted to unforeseen conditions) often prefer to use the likely range of projections,
while stakeholders with a lower risk tolerance (e.g., those deciding on critical infrastructure) also consider global and local mean sea level above the upper end of the likely range (globally 1.1 m under RCP8.5 by 2100)
and from methods characterised by lower confidence such as from expert elicitation.
Sea level projections show regional differences around global mean values.
Processes not driven by recent climate change, such as local subsidence caused by natural processes and human activities, are important to relative sea level changes at the coast.
While the relative importance of climate-driven sea level rise is projected to increase over time, local processes need to be considered for projections and impacts of sea level

Sea level rise is projected to continue beyond 2100 in all scenarios.
The uncertainty at the end of the century is mainly determined by the ice sheets, especially in Antarctica
The uncertainty at the end of the century is mainly determined by the ice sheets, especially in Antarctica

The rate of global mean sea level rise is projected to reach 15 mm/yr (10–20 mm/yr, likely range) under RCP8.5 in 2100, and to exceed several centimetres per year in the 22nd century.
Under RCP2.6, the rate is projected to reach 4 mm/yr (2–6 mm/yr, likely range) in 2100.
Model studies indicate multi-meter rise in sea level by 2300 (with low confidence, 2.3–5.4 m for RCP8.5 and 0.6–1.07 m under RCP2.6) indicating the importance of reduced emissions for limiting sea level rise.
The Greenland Ice Sheet is currently contributing more to sea-level rise than the Antarctic Ice Sheet but Antarctica could become a larger contributor by the end of the 21st century as a consequence of rapid retreat (low confidence).
Beyond 2100, increasing divergence between Greenland and Antarctica’s relative contributions to global mean sea level rise under a high emission scenario has important consequences for the pace of relative sea-level rise in the Northern Hemisphere
In coming centuries under RCP8.5, sea level rise is projected to exceed rates of several centimetres per year resulting in multi-metre rise, while for RCP2.6 sea level rise is projected to be limited to around 1m in 2300 (low confidence)
Processes controlling the timing of future ice-shelf loss and the extent of ice sheet instabilities could increase Antarctica’s contribution to sea level rise to values substantially higher than the likely range on century and longer time-scales (low confidence).
Considering the consequences of sea level rise that a collapse of parts of the Antarctic Ice Sheet entails, this high impact risk merits attention
Global mean sea level rise will cause the frequency of extreme sea level events at most locations to increase.

As a result, extreme sea level events that were historically rare, once per century, will occur much more frequently.
When are they going to occur each year ?
Many low-lying megacities and small islands are projected to experience historical centennial events at least annually by 2050 under all scenarios.

The year when the historical centennial event becomes an annual event in the mid-latitudes occurs soonest in RCP8.5 and latest in RCP2.6.
The increasing frequency of high water levels can have severe impacts in many locations depending on the level of exposure and adaptation.
This assessment assumes that that the variability of sea level remains unchanged.
Projected changes in waves arising from changes in weather patterns, and changes in tides due to sea level rise, can locally enhance or ameliorate coastal hazards.
Extreme sea levels and coastal hazards will be exacerbated by projected increases in the average intensity, magnitude of storm surge and precipitation rates of tropical cyclones, and the proportion of Category 4 and 5 tropical cyclones.
There are greater increases projected under RCP8.5 than under RCP2.6 from around mid-century to 2100
Let us now move from the sea surface into the depth of the ocean.

Due to emissions of heat-trapping gases resulting from human activities, the global ocean has warmed and has taken up more than 90% of the excess heat in the climate system, making climate change irreversible. Ocean warming also contributes to sea level rise, as seen before.

In the last decade, around half of the total heat accumulation in the global ocean has occurred in the Southern ocean, playing a disproportionately and increasing important role.
Due to warming, marine heatwaves have doubled in frequency since the 1980s and are increasing in intensity.
Surface ocean warming is making the surface ocean less dense relative to deeper parts of the ocean and inhibiting mixing and exchange of heat, carbon, nutrients and oxygen.
A loss of oxygen has occurred from the surface to 1000 m.
The ocean has taken up between 20–30% of total anthropogenic CO2 emissions since the 1980s causing further ocean acidification. The decline in surface ocean pH very likely to have already emerged from background natural variability for more than 95% of the ocean surface area.
The main current system in the Atlantic ocean, the Atlantic meridional overturning circulation, has weakened since the end of the 19th century. There is however insufficient data to quantify the magnitude of this weakening.
Over the 21st century, the ocean is projected to transition to unprecedented conditions with increased temperatures, greater upper ocean stratification, further acidification, and oxygen decline.

The ocean will take up 2 to 4 times more heat than between 1970 and the present by 2100 if global warming is limited to 2°C and up to 5 to 7 times more at higher emissions (compared to 1970).
Marine heatwaves are projected to further increase in frequency, duration, extent and intensity. Their frequency will be 20 times higher at 2°C warming, compared to pre-industrial levels.
They would occur 50 times more often if emissions continue to increase strongly.
The largest increases in marine heat wave frequency are projected for the Arctic and the tropical oceans
The annual mean density stratification of the top 200 m is projected to increase, further inhibiting vertical nutrient, carbon and oxygen fluxes.
Continued carbon uptake by the ocean by 2100 is virtually certain to exacerbate ocean acidification.
Both polar oceans will be increasingly affected by this carbon uptake, causing conditions corrosive for calcium carbonate shell-producing organisms for RCP8.5. These conditions would be avoided in RCP2.6.
In a warmer world, Extreme El Niño and La Niña events are projected to increase in frequency in the 21st century and to likely intensify existing hazards.
The Atlantic Meridional Overturning Circulation is projected to weaken.
The scale, rate and magnitude of ocean changes will be smaller under scenarios with low greenhouse gas emissions.
Hans-Otto Pörtner will cover the implications of these ocean changes for marine life in the next presentation.
Thank you for your attention.
To know more on other aspects of this report, you can watch the full presentation : unfccc-cop25.streamworld.de/webcast/joint-…
or navigate into the report : Summary for policy makers, Chapters, Frequently Asked Questions, Glossary...
ipcc.ch/srocc/
END
To know more on other aspects of this report, you can watch the full presentation : unfccc-cop25.streamworld.de/webcast/joint-…
or navigate into the report : Summary for policy makers, Chapters, Frequently Asked Questions, Glossary...
ipcc.ch/srocc/
END