We know some of you may be home with school-aged children looking for some science to do. Or you don’t have kids and just want to do some science. Either way, let us help out with some climate exercises. We’ll be sharing some going forward and taking requests on topics! 1/12
First up, heat! Extreme heat kills 100s of Americans a year and sends tens of thousands more to the hospital. Learn more at National Integrated Heat Health Information System (NIHHIS) nihhis.cpo.noaa.gov Photo Credit: Hamad M 2/12 

Let’s explore heat extremes where you live by using the Climate Explorer tool from the US Climate Resilience Toolkit. The Climate Explorer lets you check climate data for any county in the contiguous United States or borough in Alaska. crt-climate-explorer.nemac.org 3/12
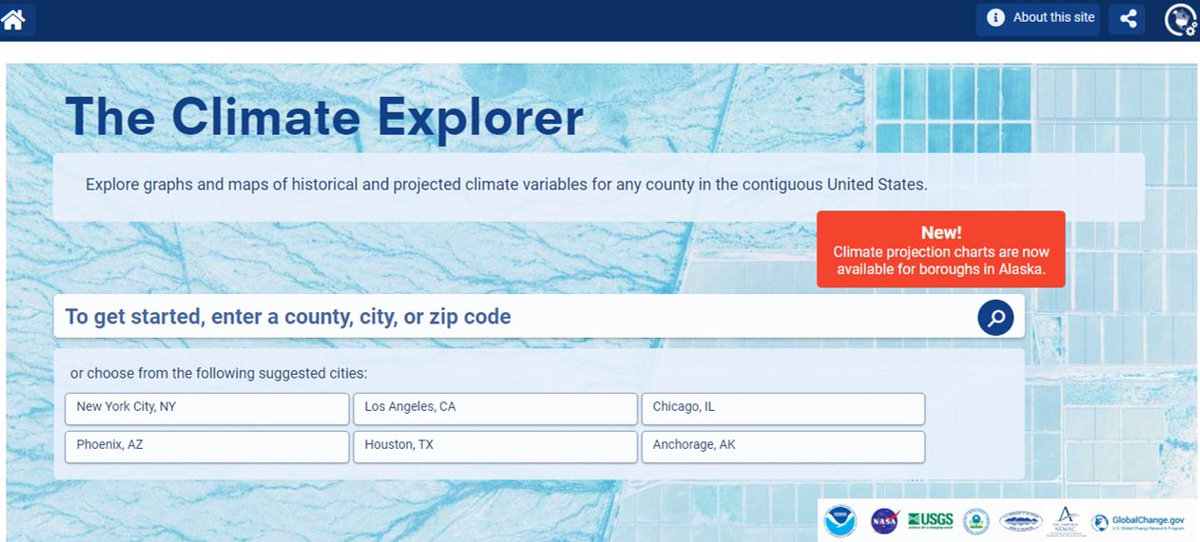
Get to Climate Explorer’s Climate Charts section by typing in your city/country into the search bar. That will take you to the climate cards screen. Click on the card that says “Climate Charts” 4/12

Let’s look at the trend in the number of days above 90°F. To change the data in the time series, select Days w/ max >90°F from the drop down menu on the top left. To learn more about what you’re looking at, click on the About the graph button in the upper right. 5/12

After clicking the Historical Observed button on the bottom left of the time series, read the chart to estimate the number of days above 90°F your community experienced in the late 1900s. 6/12

Now, let’s look forward in time as our world warms due to climate change. How many hot days (>90°F) are projected in 2100 for the higher emissions of greenhouse gases scenario (red)? And the lower emissions scenario (blue)? How do these numbers compare to last century? 7/12

What do you think that difference means for your community? Who in your community might be impacted the most by changes in the number of hot days? What are your ideas for helping them? Photo Credit: Chris Goldberg 8/12

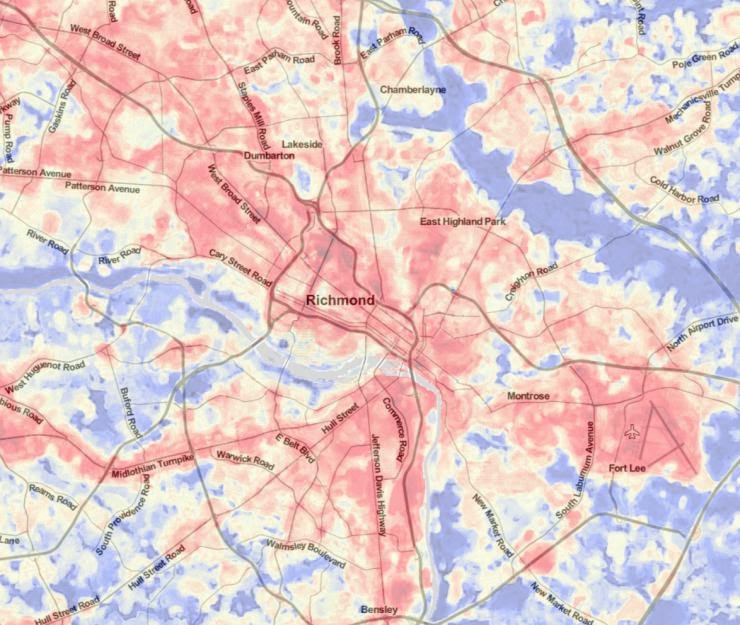
Now check out this Climate Resilience Toolkit Case Study from Richmond, Virginia and efforts they’ve taken to understand and reduce the impact of heat. Did anything surprise or interest you in their story? toolkit.climate.gov/case-studies/w… 9/12
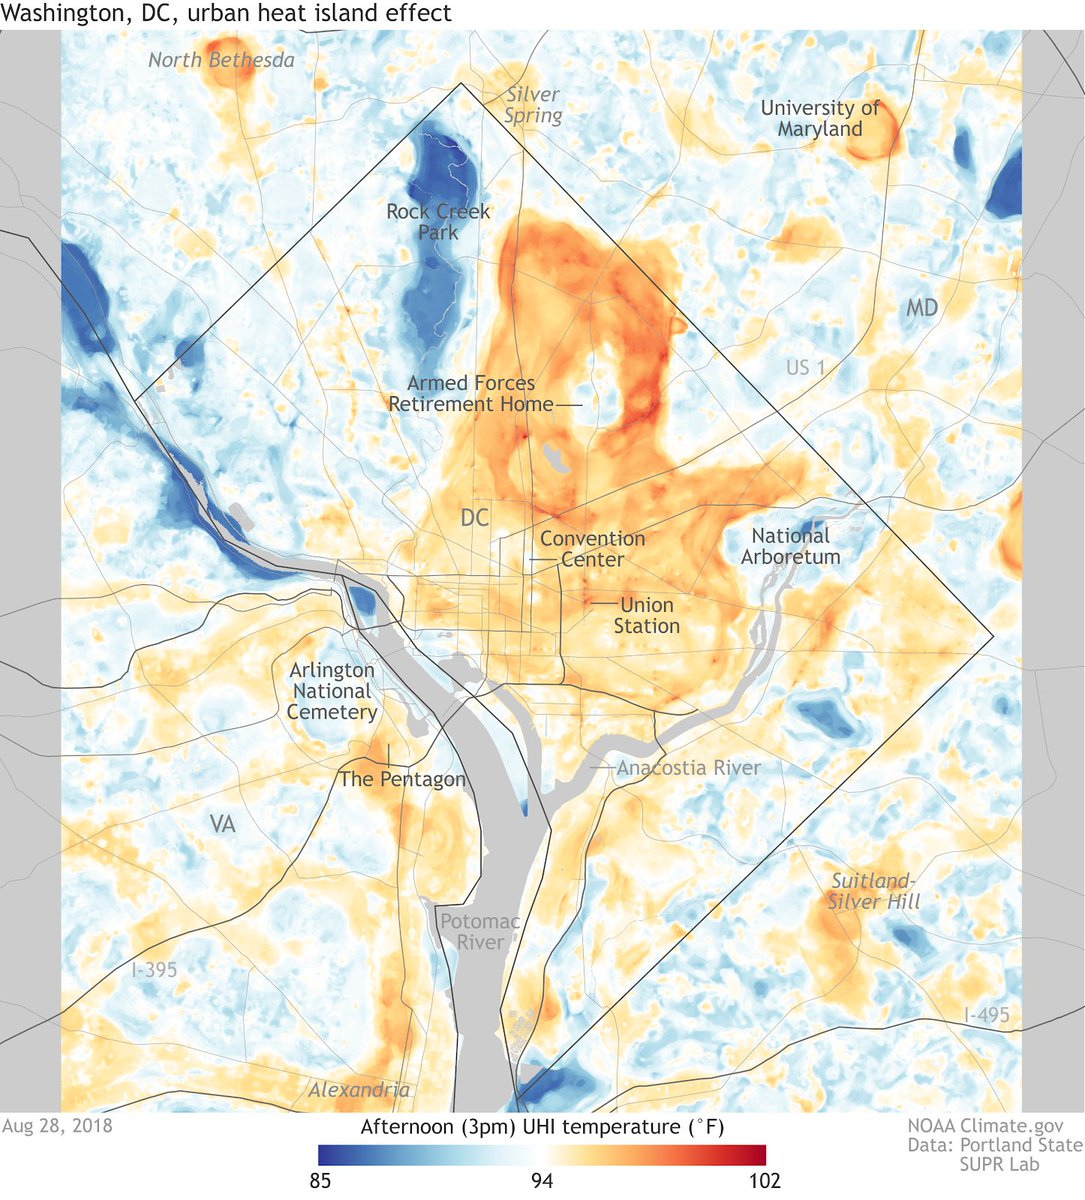
The effort to map the urban heat island in even more cities continues! That included Baltimore and Washington DC in 2018, even more cities in 2019, and even MORE scheduled for 2020. climate.gov/news-features/… 10/12
Additional resources on heat you’ll want to bookmark: Urban Heat resources from @ClimateLit cleanet.org/clean/educatio…
And the Climate Literacy Guide - cleanet.org/clean/literacy… 11/12
And the Climate Literacy Guide - cleanet.org/clean/literacy… 11/12
Be sure to check back with us soon for another climate exercise. And in the meantime, let us know how this one went! 12/12