At edecarb.org I’ve updated 24-country #electricity profiles, to 2020, with constant prices & stand-alone wind & solar, as below.
Mini-thread presents interim analysis, with time-series cross-section (TSCS) regression forthcoming for inference/significance testing
🧵
Mini-thread presents interim analysis, with time-series cross-section (TSCS) regression forthcoming for inference/significance testing
🧵

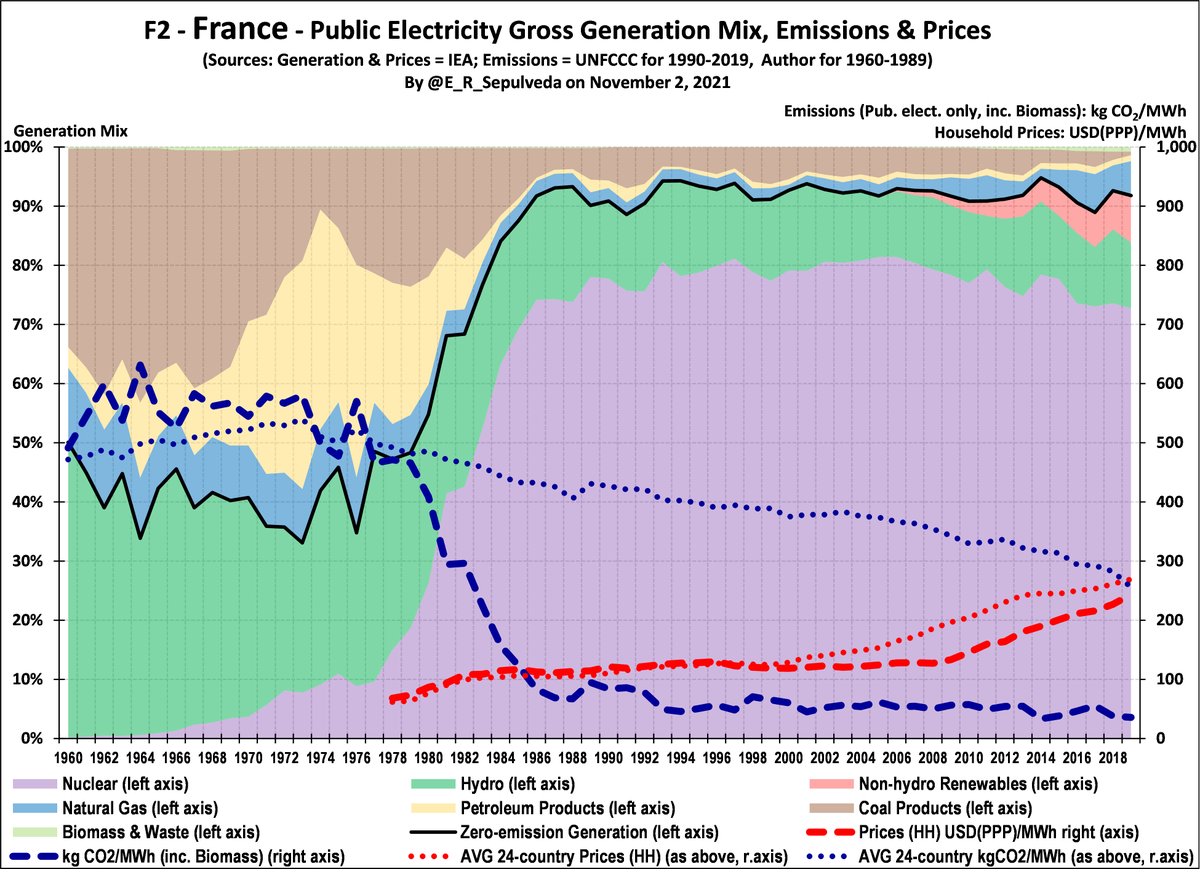
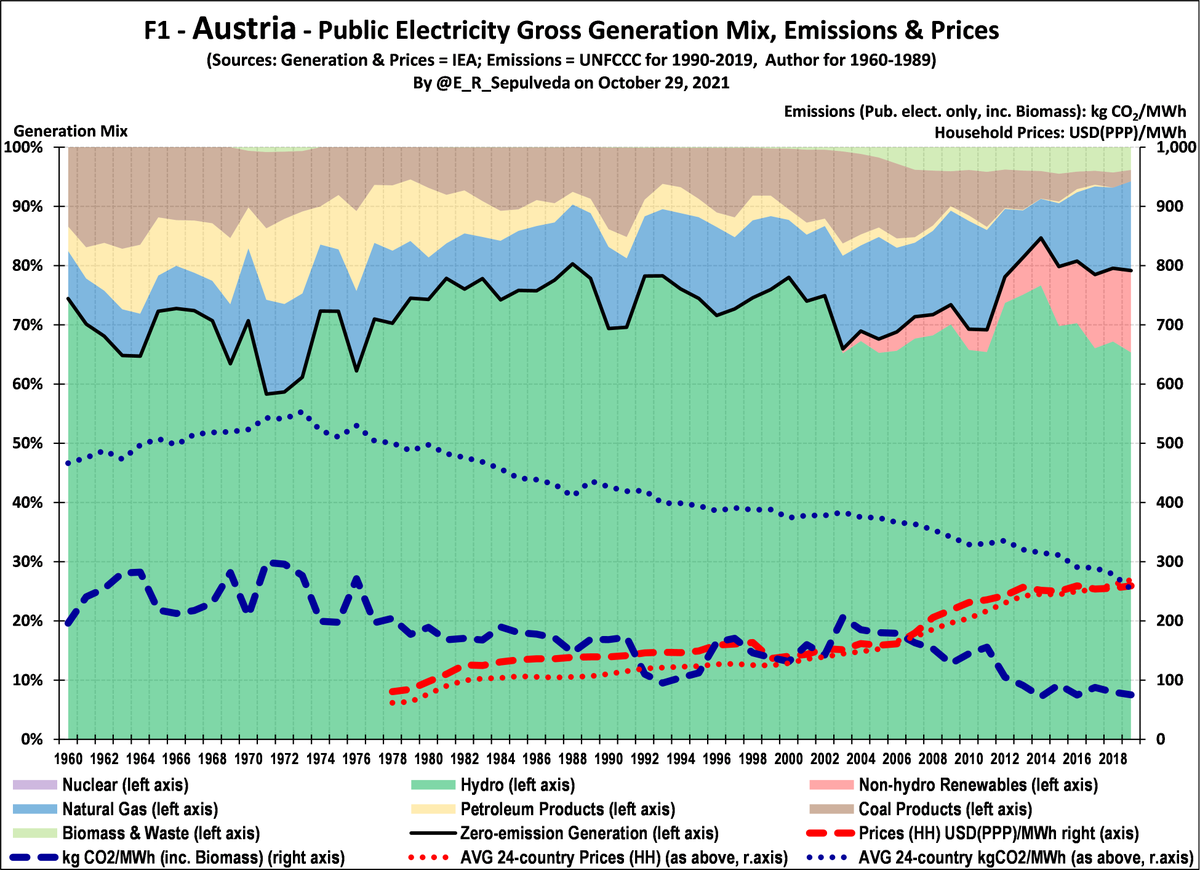
Analyzing rollout, look at sustained material peak rollout (SMPR) – any period in which Nuclear (N) or Wind & Solar (WS) expanded gen%mix >1%/year over ≈10 yrs.
Graphic shows sample countries on average rolled out N faster (3.5%) than WS (2.0%).
Graphic shows sample countries on average rolled out N faster (3.5%) than WS (2.0%).
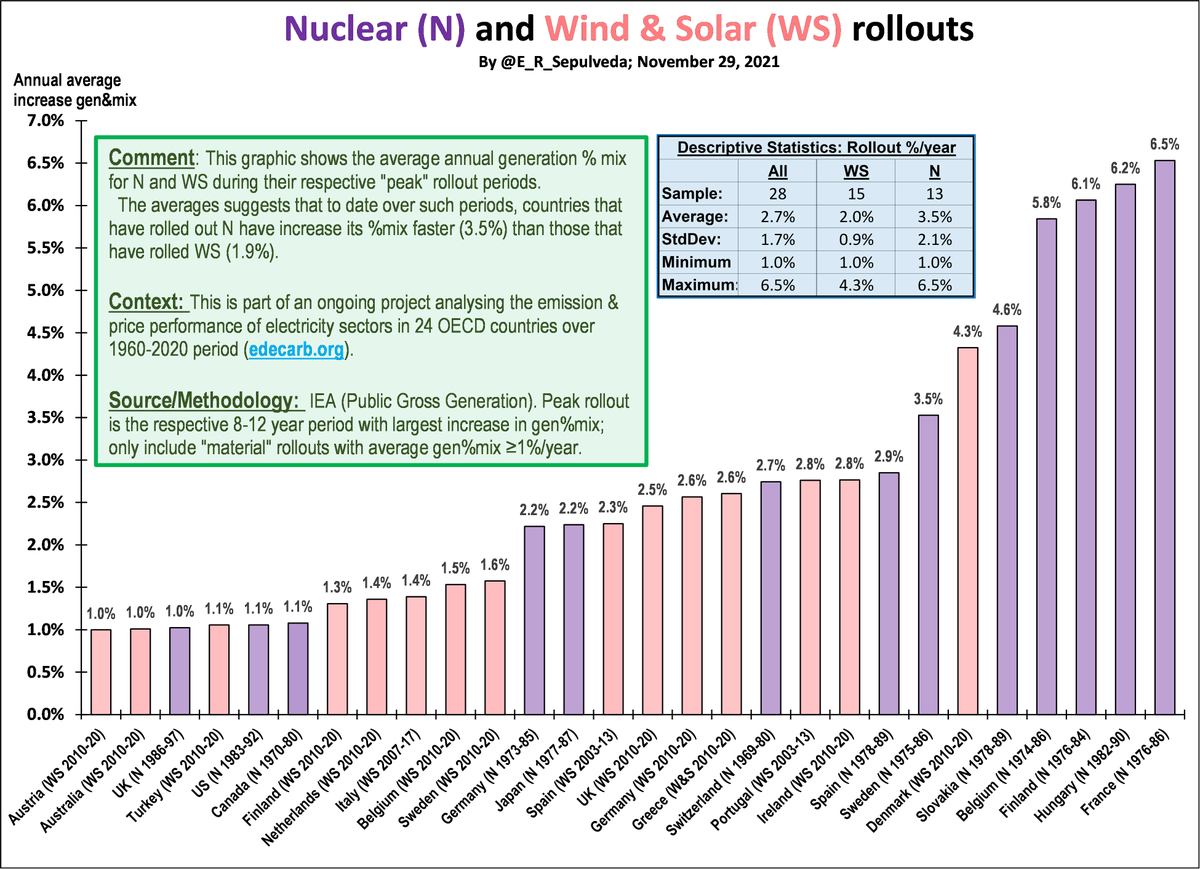
What may explain result? Am researching diff. contexts N/WS started SMPRs (avg. 1978/N; 2009/WS):
1) political/financial costs of %mix growth (i.e. adding to vs. displacing (stranded) assets) lower for N during robust TWh growth (≈8%/yr early-1970s) vs ≈0%/yr late-2000s for WS.
1) political/financial costs of %mix growth (i.e. adding to vs. displacing (stranded) assets) lower for N during robust TWh growth (≈8%/yr early-1970s) vs ≈0%/yr late-2000s for WS.
2) also means N had to compete with fossil fuel (FF) only, while WS with FF & N; 3) implement. of N facilitated by trad. State-centralized sector in 1970s, vs. liberalized & decentralized 2000s for WS.
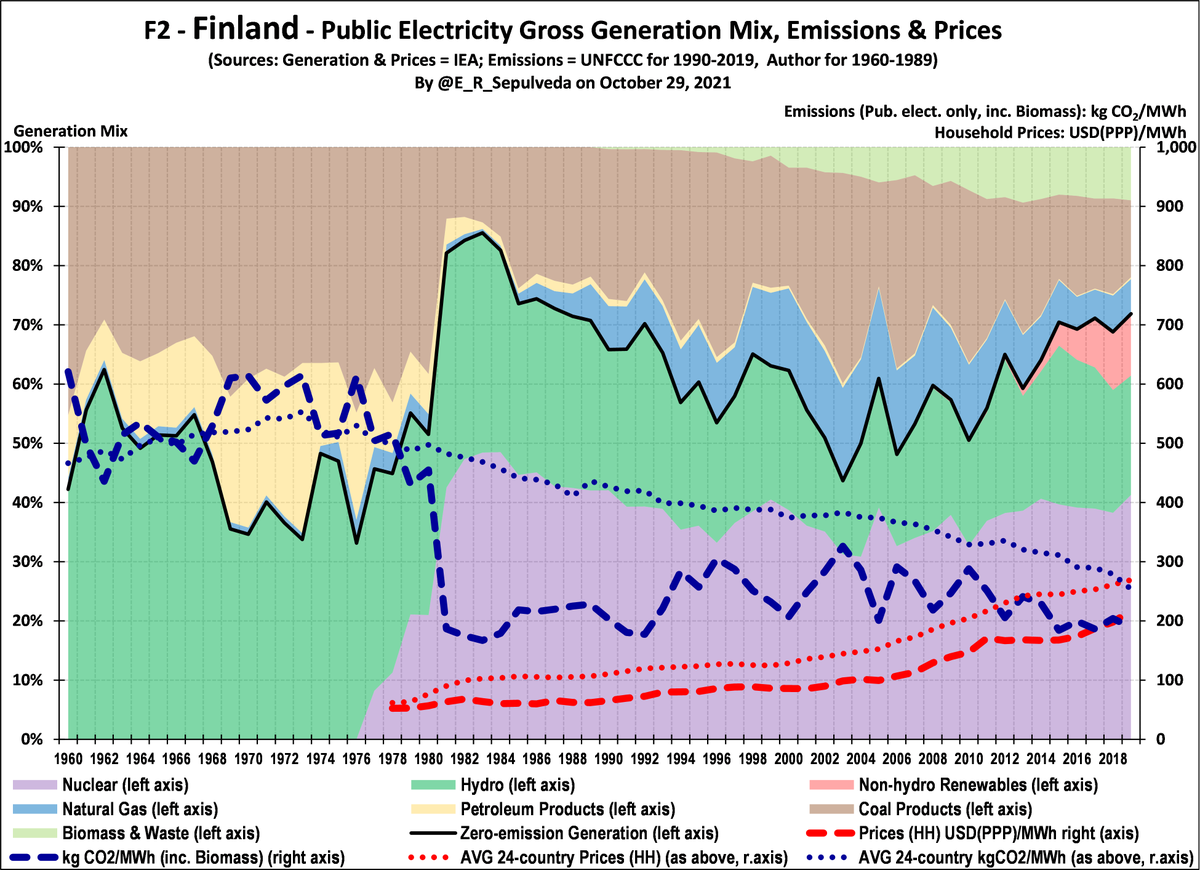
Given this, unlikely any sample WS SMPR will match BE,FI,FR,HU ≈6%/yr N SMPRs
Given this, unlikely any sample WS SMPR will match BE,FI,FR,HU ≈6%/yr N SMPRs
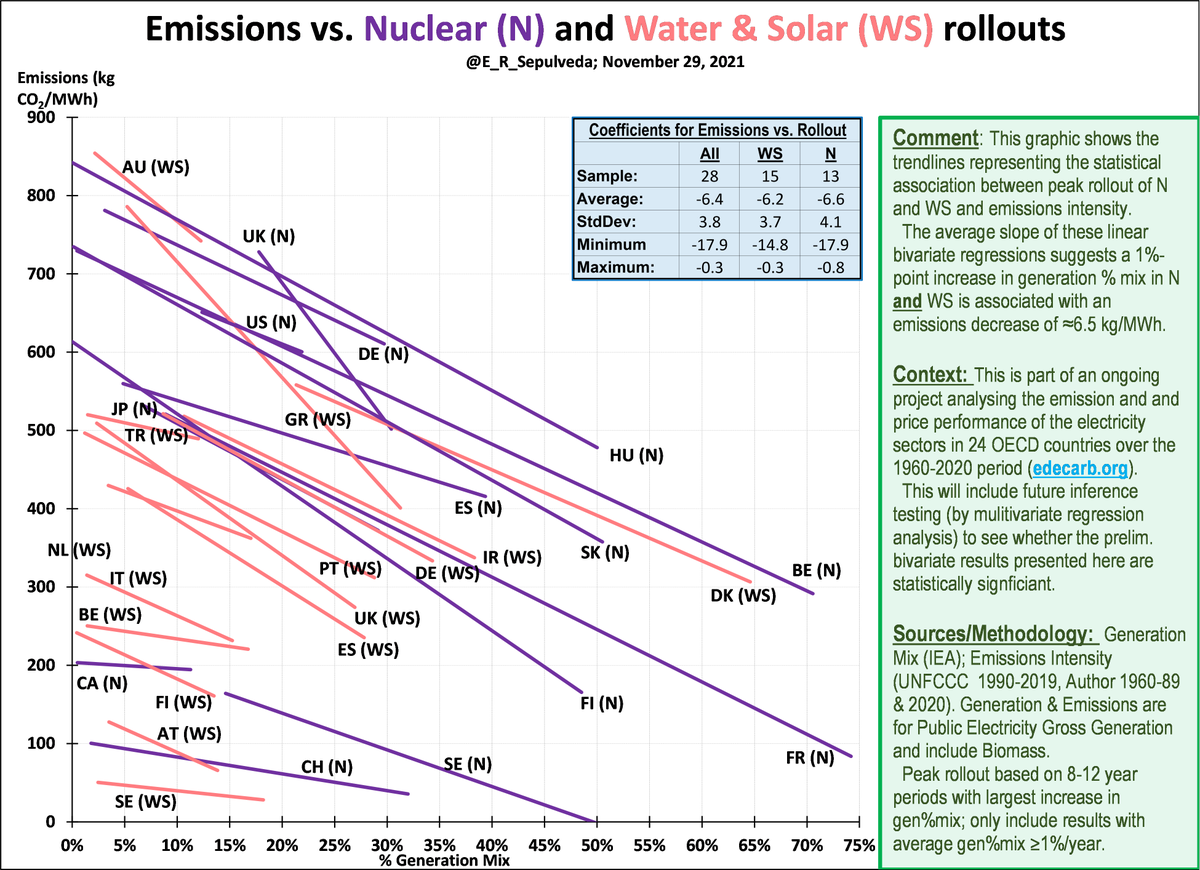
What effect of N & WS on emissions? Graphic shows simple regression analysis of SMPRs & shows that on average both N & WS associated with similar emissions reduction ≈6.5 kg/MWh per 1%mix.
Result consistent with my expectations, nevertheless, significance testing forthcoming.
Result consistent with my expectations, nevertheless, significance testing forthcoming.
How about effect of N & WS on prices? Graphic shows simple regression analysis of SMPRs & shows on average N has ≈$0 price association, but WS is associated with price increase of ≈$1/MWh per 1%mix.
Result consistent with expectations, inference/significance testing forthcoming
Result consistent with expectations, inference/significance testing forthcoming
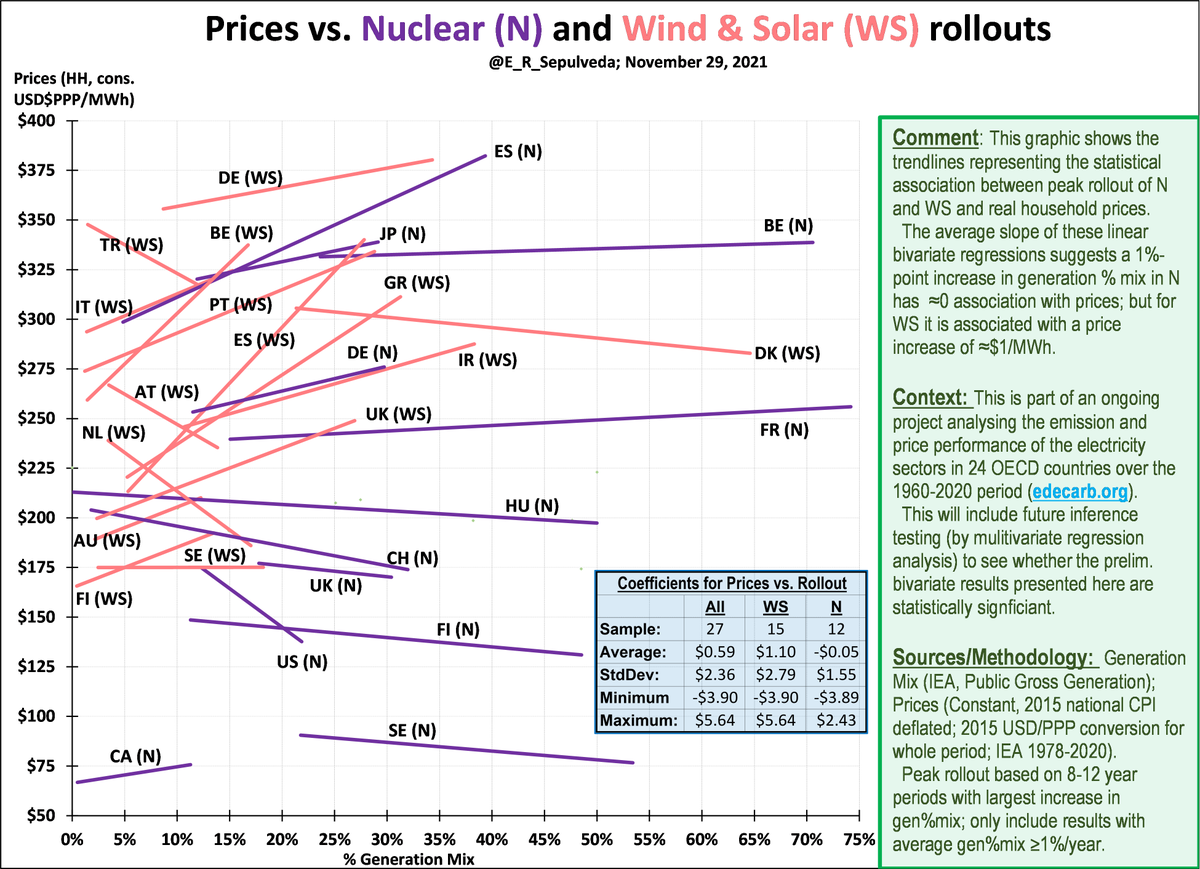
What may explain result? Am researching diff. econ regulation: 1) N prices at “cost-plus” under trad. 1970s regulation vs. WS subsidies in 2000s (e.g FIT (EEG) levies in DE); 2) whether grid-integration costs (lower gas CFs, etc.) are higher for WS than N.
bmwi.de/Redaktion/EN/A…
bmwi.de/Redaktion/EN/A…
This is an ongoing research project.
One aim is to prepare/submit time-series cross-sectional (TSCS) paper to peer-review journal.
I've started lit. review – would appreciate refs. to TSCS/quantitative electricity papers.
Check out country profiles at edecarb.org
END
One aim is to prepare/submit time-series cross-sectional (TSCS) paper to peer-review journal.
I've started lit. review – would appreciate refs. to TSCS/quantitative electricity papers.
Check out country profiles at edecarb.org
END
@threadreaderapp unroll
• • •
Missing some Tweet in this thread? You can try to
force a refresh