Which #OECD countries have lowered #electricity #emissions? How did they do it, at what pace, at what price?

My 4th round of 4-country profiles: #Austria #Finland, #Italy & #USA

For comparison, I now also include price & emissions average (AVG) from full 24-country sample!

🧵
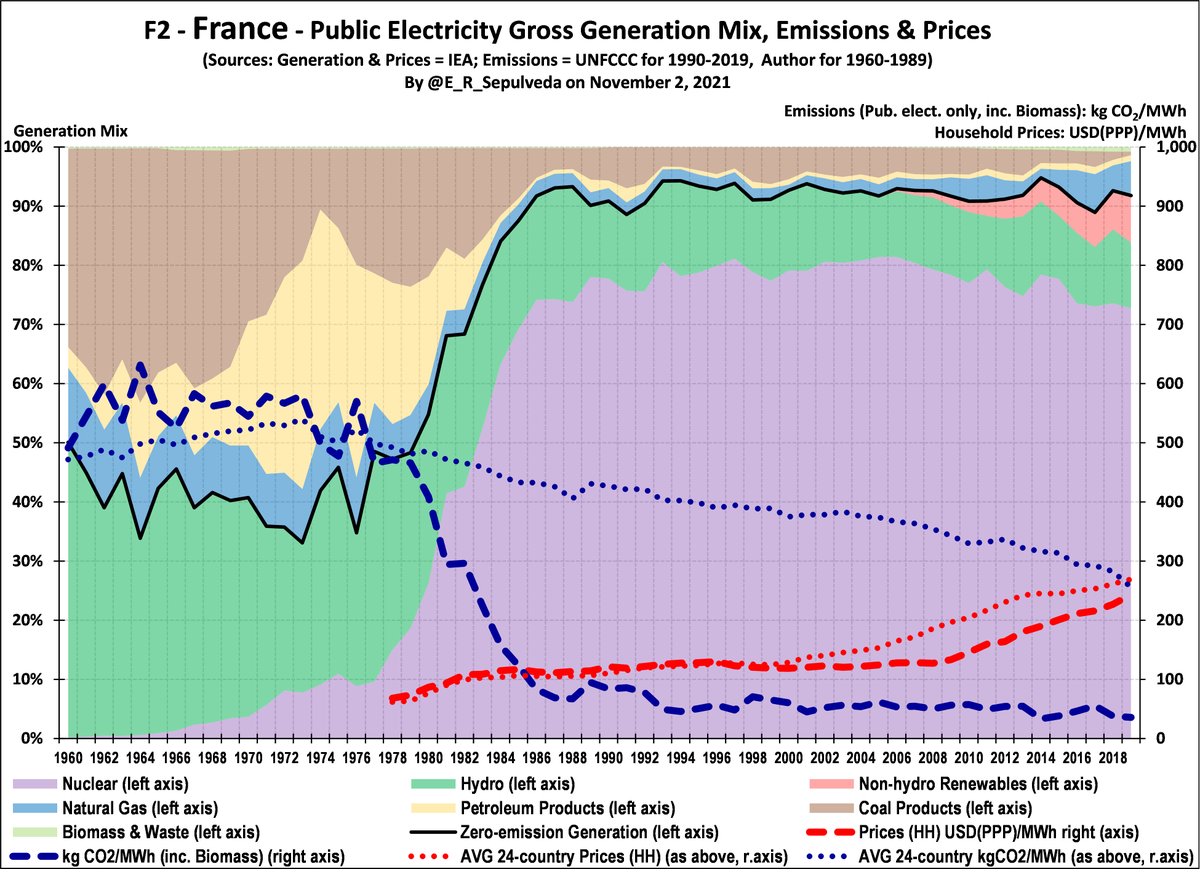
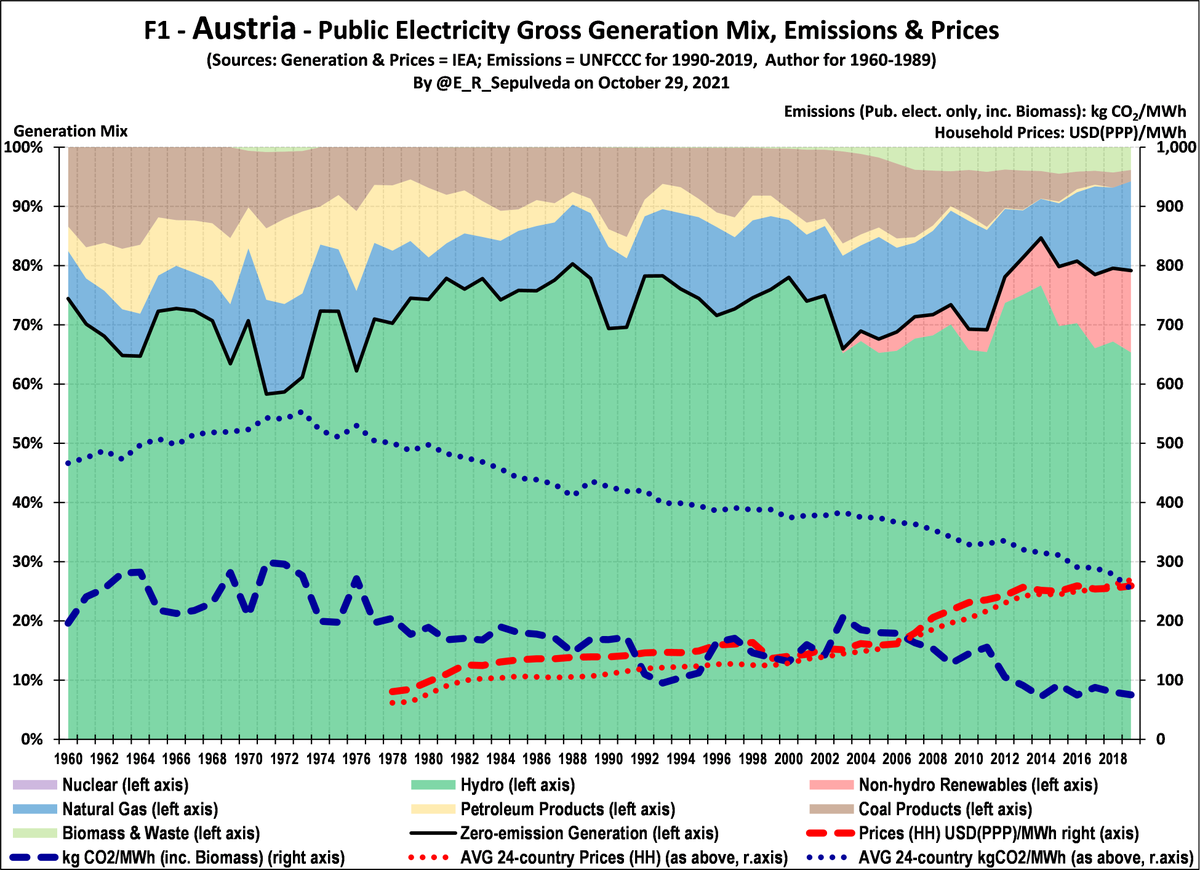
First off, Austria, with ample hydro resources (70%), resulting in whole-period low emissions, well below 24-country AVG
Remaining oil & coal now replaced with non-hydro renewables & gas, further lowering emissions
Prices have tracked AVG prices, with increase last 15 years Image
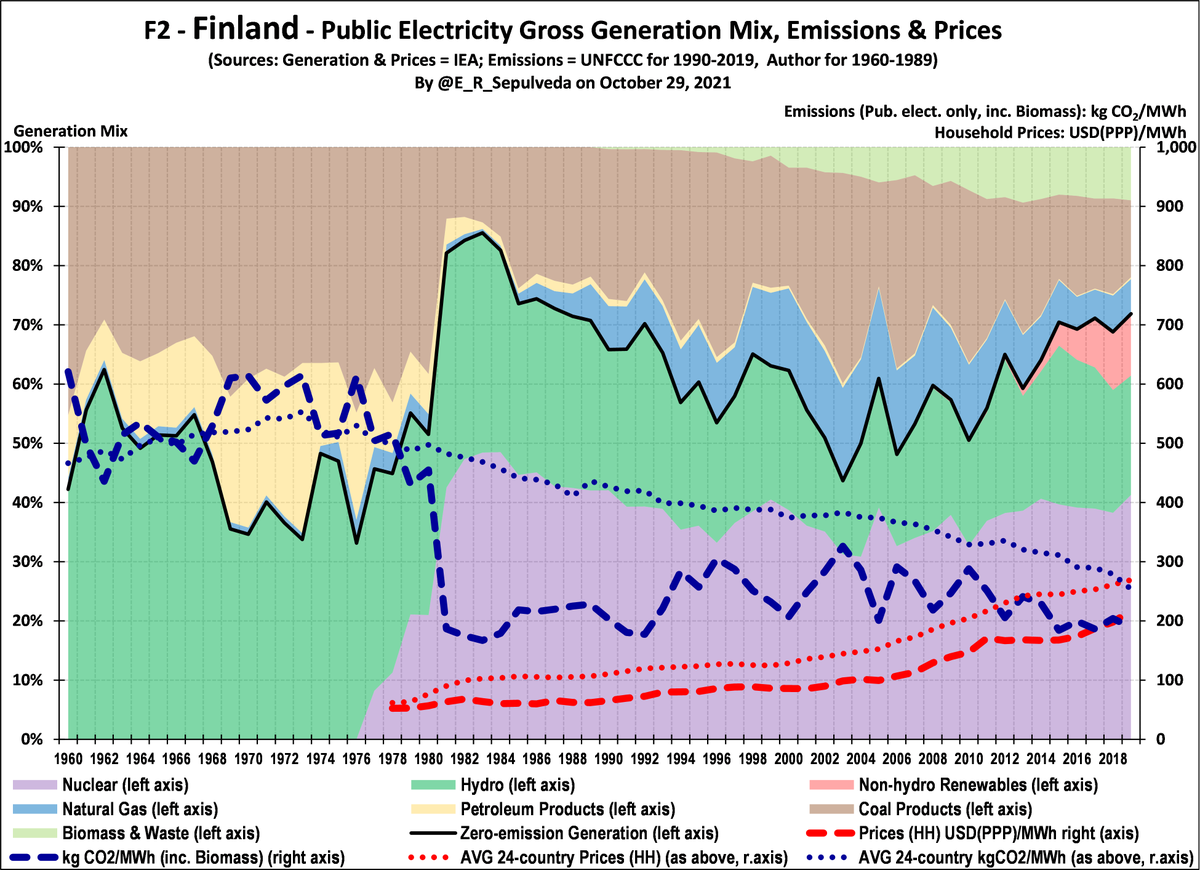
Finland reduced emissions intensity by 70% in 8 years due to nuclear rollout of late-1970s. Went from AVG to low emissions, maintaining below-AVG prices.

Emissions have stayed below AVG with stable nuclear & hydro stable, supplemented by non-hydro renewables recently. Image
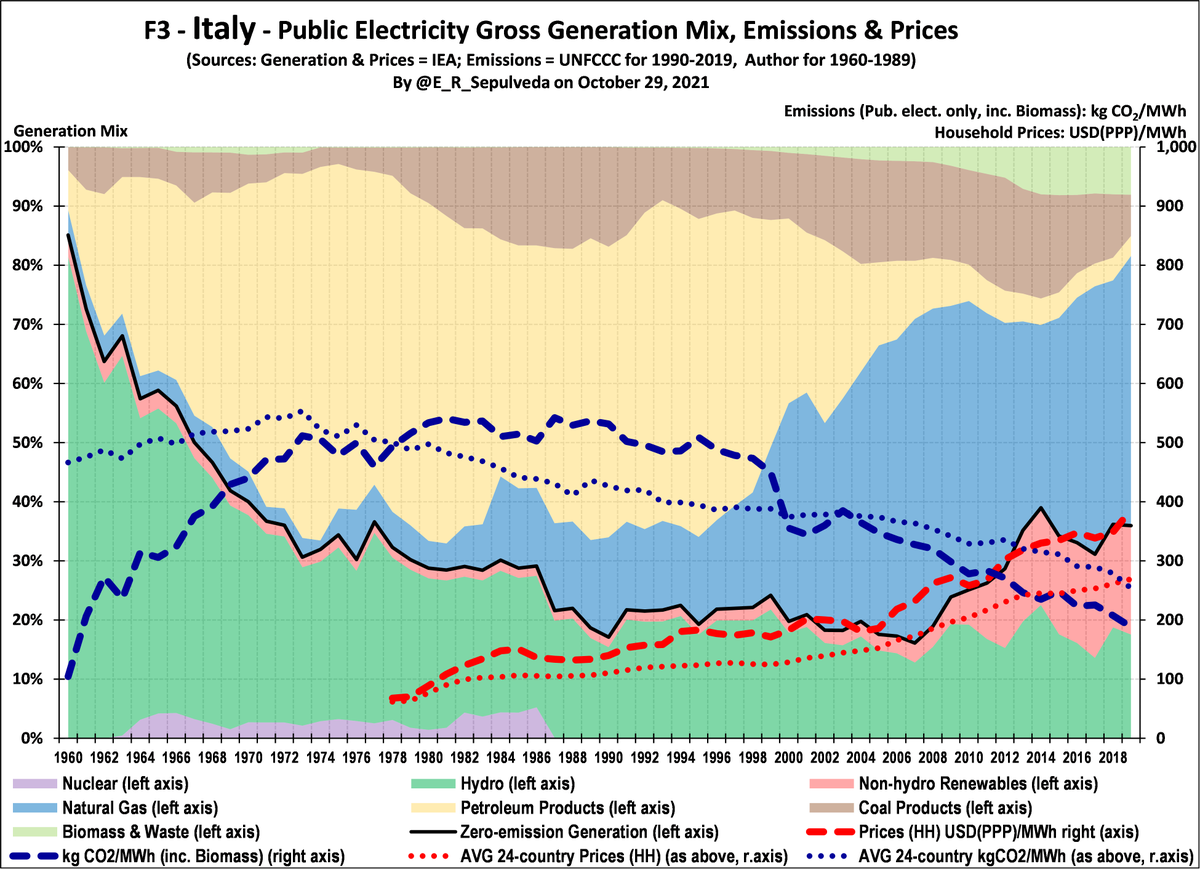
Italy is interesting for two reasons: no other country increased emissions as much from 1960 to 1990, because all new demand was met by FF; & only sample country to shut down nuclear (post-Chernobyl).
Prices have spiked last decade as non-hydro renewables & gas displace oil. Image
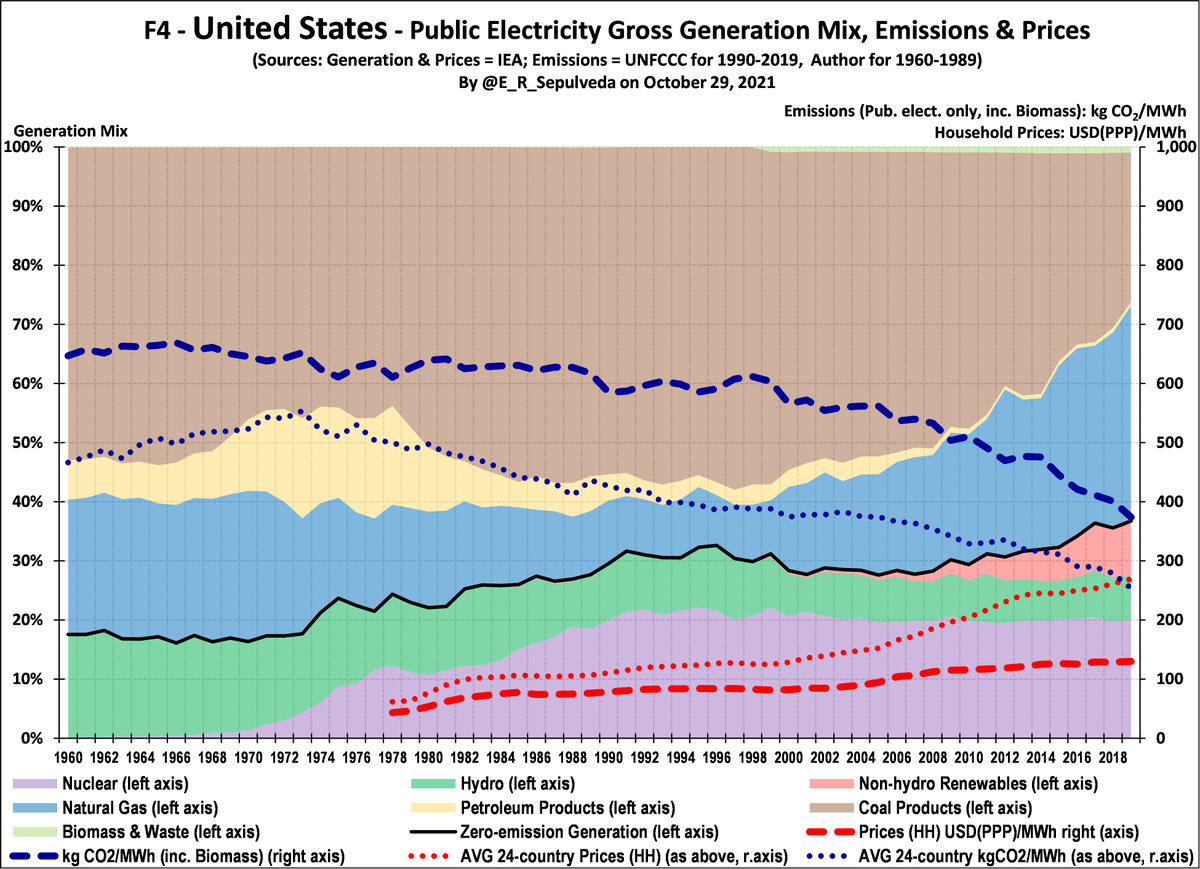
Lastly, USA has had higher emissions & lower prices than AVG over entire period.

Emissions first decreased moderately as nuclear displaced some gas & oil. From 1998, based on stable nuclear & hydro, gas & non-hydro renewables displaced some coal.
Prices rel. stable over period Image
Eight #OECD countries remaining in the series, including #Belgium, #Denmark, #France, #Germany, #Greece, #Netherlands, #NZ, #Slovakia

Stay tuned.

• • •

Missing some Tweet in this thread? You can try to force a refresh
 

Keep Current with Edgardo Sepulveda

Edgardo Sepulveda Profile picture

Stay in touch and get notified when new unrolls are available from this author!

Read all threads

This Thread may be Removed Anytime!

PDF

Twitter may remove this content at anytime! Save it as PDF for later use!

Try unrolling a thread yourself!

how to unroll video
  1. Follow @ThreadReaderApp to mention us!

  2. From a Twitter thread mention us with a keyword "unroll"
@threadreaderapp unroll

Practice here first or read more on our help page!

More from @E_R_Sepulveda

2 Nov
Which #OECD countries have lowered #electricity #emissions? How did they do it, at what pace, at what price? #COP26

My 5th round of 4-country profiles: #Denmark, #France, #NewZealand, #Slovakia

Include emissions & price averages (AVG) from 24-country sample 4 comparison!

🧵
With no hydro resources, Denmark relied on coal & oil and had very high emissions until early 2000s when non-hydro renewables (RE) & gas started to displace coal.
Since then, RE has grown but so has biomass, so that emissions lowered to AVG.
Prices have increased well above AVG. Image
France reduced emissions intensity by 80% in 11 peak years of nuclear rollout of late-1970s. Went from AVG to very low emissions, maintaining AVG prices.

Emissions have stayed very low with stable nuclear & some hydro, sup. by small non-hydro renewables. Prices remain below AVG. Image
Read 6 tweets
6 Jun
Thx again @Dr_Keefer for invite to discuss energy equity on @DecouplePodcast

Equity is one of the main reasons I decided to research electricity

We discussed global & USA electricity access, usage, poverty & distribution, so this "side" thread unpacks some of these trends

🧵
2/n. UN SDG Goal 7.1 is to have universal access to electricity by 2030

F1 shows access in urban areas has increased from 94% to 97% overall

USA, Canada & OECD achieved this generations ago; India and Middle Income countries more recently and now LDCs still have 20% gap
3/n. Lower population density & incomes have always made rural electrification a challenge...

F2 shows rural access lags urban, with global access increased from 65% to 83%

China & India have made great strides, but challenge remains in LDCs where less than half have access
Read 10 tweets
3 May
1/n. With @Dr_Keefer we covered a lot of ground/angles on @Decouple on history/politics of electricity restructuring.

Thread: annotated US/UK-centric reading list on comparisons & “lessons learned”, with emphasis on future investment for decarbonization

anchor.fm/chris15401/epi…
2/n. There are many ways to compare performance "traditional" vs. "restructured" USA states.

An influential analysis by @BorensteinS & Bushnell (2015) argues restructuring did not lower retail prices and was mostly driven by “pursuit of quasi-rents”.

energy.ucdavis.edu/wp-content/upl…
3/n. In a very recent paper, Ken Rose et al (2021) confirm that retail prices have increased in restructured states relative to traditional states, after controlling for a series of other variables...

papers.ssrn.com/sol3/Delivery.…
Read 10 tweets
30 Apr
1/n. Who can be opposed to "energy democracy", right?

When writing my 2018 @ccpa article on the Ontario, Canada electricity reforms, I wanted to explore whether the now-revoked Green Energy Act (GEA) had "democratized" electricity supply.

policyalternatives.ca/publications/m…
2/n. Cost side of GEA ledger is known (+prices, +budgets, etc.), but could we add "democracy" to benefits side?
Gov't promoted GEA based on Germany, where 50% RE contracts are co-ops+.
In prepping for @Dr_Keefer episode, looked for updated Ontario %

anchor.fm/chris15401/epi…
3/3. Data hard to come by; in 2018 I estimated 5% RE contracts were coops.
New PhD calculates only 3.3%, stating "GEEA turned out to be a failure on energy democracy front, continuing...corporate welfare"
So no, the GEA did not "democratize" the grid...
tspace.library.utoronto.ca/handle/1807/10…
Read 4 tweets
15 Apr 20
1/N: My previous 9-country #COVID19 age-based case analysis was "static" due to data limitations, etc.

In this thread I present a dynamic analysis of case rates for high-risk age groups since the beginning of the pandemic in #Italy, #Spain, #Germany, #Canada & #Chile

Thread...
2/N: Focus is on 60+ age groups because, due to higher CFRs, these account for 90-95% of all fatalities

To reduce fatalities in current AND future #COVID19 waves, it is critical to understand case dynamics & whether "real" and generalized and if so, what are possible drivers?
3/N: @AndreasShrugged beat me to presenting dynamic analysis for #Germany & started interesting discussion, which can now be generalized based on 4+ countries

F3 presents same data differently (distinct periods, excl <60), with same results - an increase in cases for 80+ group
Read 12 tweets
29 Mar 20
1/N: March 29 snapshot of #COVID19 8-country (CN, KR, IT, ES, FR, DE, US, CA, CL) analysis: age data to March 26; cases to March 28

High-risk age groups (60+) are 75-90% of deaths, but only 15-20% pop; based on data "deep dive", how well have such groups been protected to date?
2/N: As discussed by @drjenndowd, @AndreasShrugged,
@firefoxx66 et al, population structure matters.

F1 shows % of national pop in each of three high-risk age groups:

1) IT/ES/FR/DE are higher risk, with IT highest risk
2) CN/KR/CL are lower risk
3) US/CA have medium risk
3/N: F2 shows % national confirmed cases by high-risk age groups

Testing regimes affects # & distribution of cases, especially in initial phases; with that caveat: F2 is consistent with lower current CFRs in CN/KR/DE & higher in IT/ES/FR. CFRs in US/CA/CL still evolving....
Read 8 tweets

Did Thread Reader help you today?

Support us! We are indie developers!


This site is made by just two indie developers on a laptop doing marketing, support and development! Read more about the story.

Become a Premium Member ($3/month or $30/year) and get exclusive features!

Become Premium

Too expensive? Make a small donation by buying us coffee ($5) or help with server cost ($10)

Donate via Paypal Become our Patreon

Thank you for your support!

Follow Us on Twitter!

:(