THREAD: Today the European @EU_Commission released its eagerly awaited 'Long Term Strategy' for decarbonizing the European economy, which includes reflections on how to reach 'carbon neutrality' by 2050. But the analysis also includes a lot of interesting results on 2030. 1/
The documents released today include both a 25pg political document known in EU speak as a 'Communication', as well as a 396pg 'In Depth Analysis' with modelling insights and inputs from nearly all Commission services. The scope is impressive. 2/
ec.europa.eu/clima/news/com…
ec.europa.eu/clima/news/com…
As part of this analysis the Commission made the excellent choice of assuming the successful and cost-effective achievement of its recently finalized 2030 Climate & Energy target framework as the foundation for its 'Baseline' Scenario. 3/
Previous modelling from March already showed that the energy efficiency (32.5%) and renewables (32%) targets included in this framework leads to greenhouse gas emission reductions that go significantly beyond the officially agreed GHG target of -40%. 4/ euractiv.com/section/energy…
Changes were also made to the modelling assumptions to reflect implementation of recently agreed legislation (eg. RED, EED, EPBD, ESR, LULUCF, ETS revision), Commission proposals for ongoing transport files (eg. CO2 standards for cars), and more accurate technology data . 5/
As such, next to the eight additional 2050 scenarios, the new modelling work for this baseline scenario also represents the best effort to date to model the impact of EU climate & energy policies in a 2030 perspective. So what are the high level results for 2030? 6/
1) Excluding the LULUCF sinks, the total GHG emissions in 2030 for the Baseline scenario is estimated at -46% of 1990 level. Including LULUCF sink, net GHG emissions actually reduce by 48% by 2030 compared to 1990. 7/ 

These results are similar to the 33%RES/33%EE scenario previously modelled during the negotiations of the RED and EED and leaked in March, implying that improved technology costs and policy frameworks are already overhauling modelling done earlier this year. 8/
2) In reaching the 2030 renewables and energy efficiency target, both the ETS and non-ETS targets are overachieved in 2030. Moreover, the over-achievement in the ETS sector results in an increased surplus of allowances. 9/
The Market Stability Reserve (MSR) has been designed to address such situations, absorbing such surpluses above a threshold. Nonetheless, the ETS price would be held relatively moderate due to reduced scarcity. 10/
In the Baseline scenario, the model used projects an ETS carbon price of EUR 28 per tonne of CO2 (in 2013 prices) for 2030, as no further (possible) corrections are assumed (eg. voluntary cancellation of certificates, carbon floor price or ETS cap revision). 11/
3) The composition of (reduced) Gross Inland Energy Consumption changes significantly from 2015 and 2030, with declines in oil & coal/growth in RES:
Oil 📉 (30% vs 25%)
Natural gas 📉 (21% vs 20%)
Coal 📉 (17% vs 11%)
Nuclear = (14% vs 14%)
Renewables 📈 (13% vs 25%)
12/
Oil 📉 (30% vs 25%)
Natural gas 📉 (21% vs 20%)
Coal 📉 (17% vs 11%)
Nuclear = (14% vs 14%)
Renewables 📈 (13% vs 25%)
12/

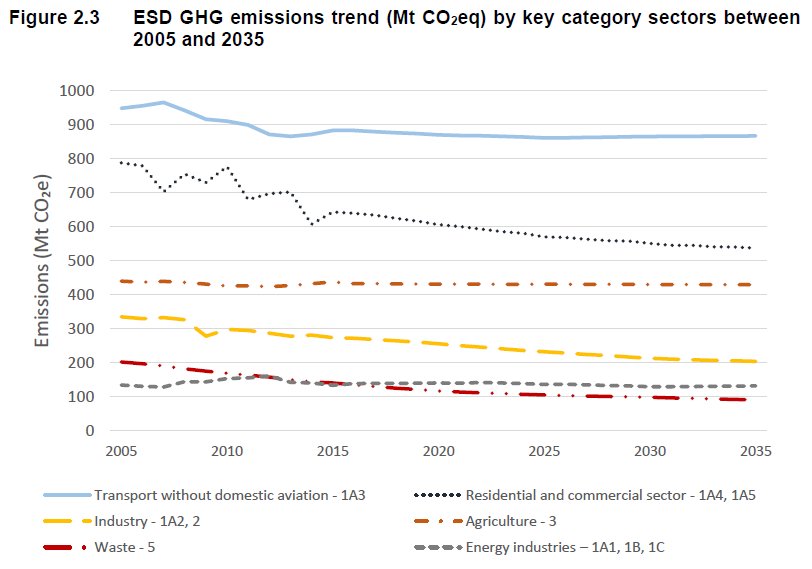
4) Reduced Final Energy Consumption until 2030 is expected to be achieved in particular through reductions in the residential sector, with the transport sector playing a smaller role, despite 2050 scenarios showing that it has significant untapped potential. 12/

5) Electrification increases moderately until 2030, growing from 22% in 2015 to 29% in 2030 in terms of final energy consumption. The most significant growth is in the residential sector, followed by services, industry and (by some margin) transport. 13/


6) However, despite an increase in the share of electricity consumption, electricity demand/generation only increases slightly in the 2030 perspective, and an order of magnitude less than increases expected in some 2050 scenarios. 14/

7) In terms of gross electricity generation the share of renewables increases from 30% in 2015, to 57% in 2030. By contrast, the share of nuclear is projected to decline from 26% in 2015 to 18% in the 2030. 15/

Among renewables, wind is clearly the dominant technology, increasing from 9% in 2015 to 26% in 2030, with large increases in Offshore Wind. However, the share of solar also grows significantly from 3% in 2015 to 11% in 2030. Together wind and solar reach 37% in 2030. 16/
8) In terms of installed power capacity, wind increases to 350 GW in 2030, up from 141 GW in 2015. Solar capacity starts from smaller base (95 GW in 2015), but grows rapidly to 320 GW in 2030. Wind and solar alone represent 53% of total net capacity installed by 2030. 17/


Other renewables (mostly hydro and biomass) go through more modest development and nuclear installed capacity is projected to decline from 122 GW in 2015 to 97 GW in 2030. 18/
9) Electricity storage also plays an increasingly prominent role by 2030. The use of conventional/"direct" storage, in the form of pumped hydro or stationary batteries is projected to increase from about 30 TWh today to some 70 TWh in 2030. 19/

In terms of conventional/"direct" electricity storage, pumped hydro storage is projected at 51 GW in 2030 (that is close to the 2015 level), while stationary batteries would grow to 29 GW in 2030 (from negligible amounts today). 20/

10) The consumption of natural gas (excluding non-energy use) is expected to significantly decline from 345 Mtoe in 2015 to 273 Mtoe in 2030. As a result, net imports of natural gas decline from 247 Mtoe in 2015 to some 220 Mtoe in 2030. 21/

The consumption of biogas is projected to increase from 16 Mtoe in 2015 to some 30 Mtoe in 2030, and is mainly used in the power and industry sectors. 22/

As a result, total gas consumption (covering all gas types) declines from some 370 Mtoe in 2015 (and some 450 Mtoe at its peak, in 2005) to some 320 Mtoe in 2030. 23/


13) Overall net fossil fuels imports decline from some 900 Mtoe in 2015 to some 730 Mtoe in 2030. However, due to declining domestic production the dependency of the total EU energy consumption imports (mostly fossil fuels) only declines from 55% in 2015 to 52% in 2030, 24/