,
12 tweets,
3 min read
Read on Twitter
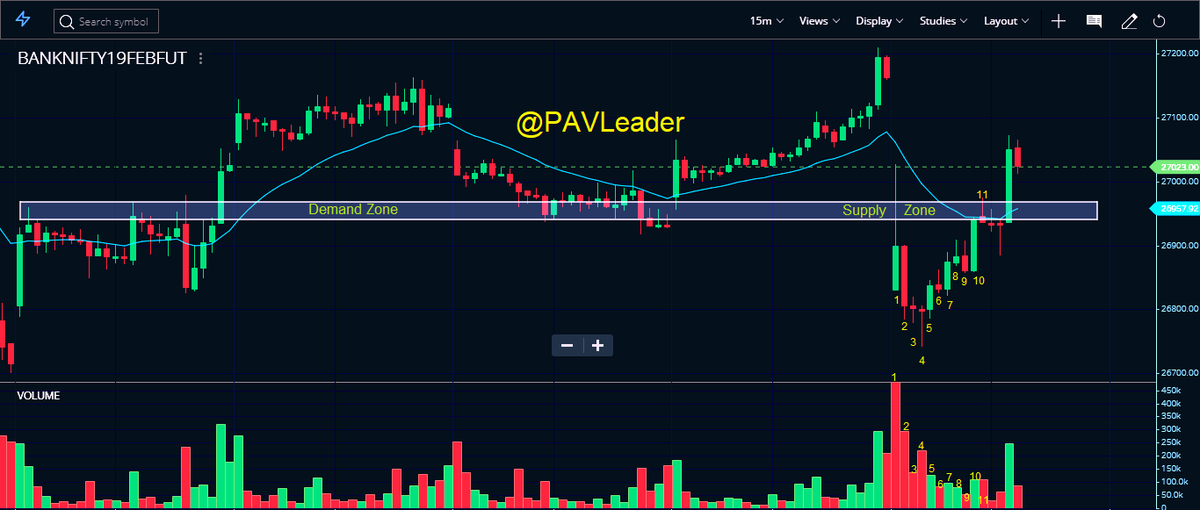
As promised I am sharing the commentary of today's #PriceAction on #BankNifty future 15 minutes chart. I trust you will find it useful for learning purpose.
Each bullet point is reference with the candle number for easy understanding.
#TradeWithPAL
Each bullet point is reference with the candle number for easy understanding.
#TradeWithPAL
1/n
1. Gap down open, price closed below demand zone with ultra high volume. Long upper wick, signs of selling pressure.
1. Gap down open, price closed below demand zone with ultra high volume. Long upper wick, signs of selling pressure.
2/n
2. Next candle bearish with less vol than prev candle, price closed below 1st candle, small tail. Selling pressure continued
2. Next candle bearish with less vol than prev candle, price closed below 1st candle, small tail. Selling pressure continued
3/n
3. Small Doji with even lesser volume. Indecision (small candle shows bears are losing steam & bulls have started showing interest)
3. Small Doji with even lesser volume. Indecision (small candle shows bears are losing steam & bulls have started showing interest)
4. Long lower wick/tail with higher vol than prev candle & close towards the upper range of body. Shows buying interest from bulls. Had it been a Green candle, it would have been more stronger but still its good candle for bulls. This is signal bar but confirmation is yet to come
5/n
5. This is bullish close towards the top with good volume. Shows strength & confirms the previous buying. If earlier candle would have had fake buying then this candle shouldn't have closed positive.
5. This is bullish close towards the top with good volume. Shows strength & confirms the previous buying. If earlier candle would have had fake buying then this candle shouldn't have closed positive.
6/n
6. Small/weak inverted hammer with lesser volume. Some bears are active but are they enough to drag the price down again? Lets see
6. Small/weak inverted hammer with lesser volume. Some bears are active but are they enough to drag the price down again? Lets see
7/n
7. Next candle broke the low of candle 6 but price couldn't fall further. Rather it rose up with long bullish candle & close towards the high with higher vol compared to candle 6. Shows strength.
7. Next candle broke the low of candle 6 but price couldn't fall further. Rather it rose up with long bullish candle & close towards the high with higher vol compared to candle 6. Shows strength.
8 & 9/n
8 & 9. Next 2 candles are weak candles (upper wicks) but without any considerable volume. Possible profit booking by weak buyers who bought near the lows.
8 & 9. Next 2 candles are weak candles (upper wicks) but without any considerable volume. Possible profit booking by weak buyers who bought near the lows.
10/n
10. Next candle super bullish rejecting all wicks in candle 8 & 9. This shows bulls are still active & may take price further up. This hit supply zone with confluence of EMA21 & it is prudent to book some profits. Range is between 26950-26965 hence I advised to book profits.
10. Next candle super bullish rejecting all wicks in candle 8 & 9. This shows bulls are still active & may take price further up. This hit supply zone with confluence of EMA21 & it is prudent to book some profits. Range is between 26950-26965 hence I advised to book profits.
11/n
11. As you can see price penetrated this supply zone briefly & fell down sharply where it found support by bulls which has pushed price higher again & this time when it broke the previous high (candle 11) above supply zone, it rose swiftly (taken heavy SL of all bears).
11. As you can see price penetrated this supply zone briefly & fell down sharply where it found support by bulls which has pushed price higher again & this time when it broke the previous high (candle 11) above supply zone, it rose swiftly (taken heavy SL of all bears).
12/12
As I always say context matter. Look to the left to know the supply & demand zone. Know the key levels & watch out for price rejection or reversal candles.
Hope this is helpful. Do share your feedback.
Keep learning, keep growing!
As I always say context matter. Look to the left to know the supply & demand zone. Know the key levels & watch out for price rejection or reversal candles.
Hope this is helpful. Do share your feedback.
Keep learning, keep growing!