I've made this cheat sheet and I think it's important. Most stats 101 tests are simple linear models - including "non-parametric" tests. It's so simple we should only teach regression. Avoid confusing students with a zoo of named tests. lindeloev.github.io/tests-as-linea… 1/n
For example, how about we say a "one mean model" instead of a "parametric one-sample t-test"? Or a "one mean signed-rank model" instead of a "non-parametric Wilcoxon signed rank test"? This re-wording exposes the models and their similarities. No need for rote learning. 2/n 

Or in R:
lm(y ~ 1) instead of t.test(y)
lm(signed_rank(y) ~ 1) instead of wilcox.test(y)
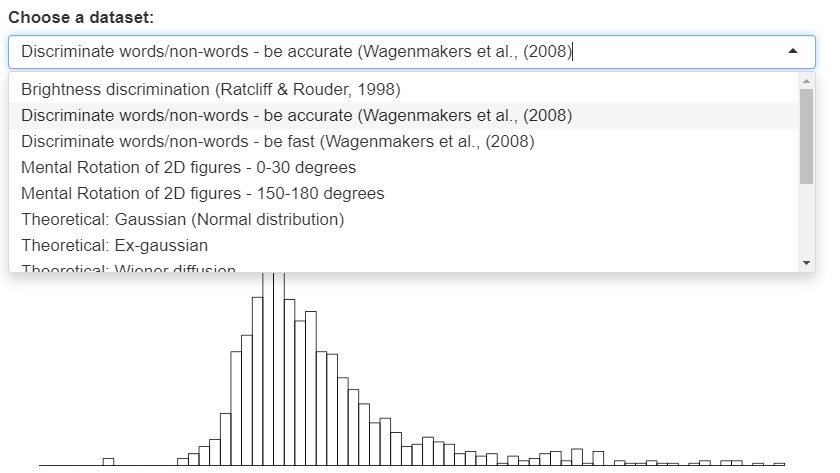
The results are identical for t.test and highly similar for Wilcoxon. The images show results when N=50. 3/n
lm(y ~ 1) instead of t.test(y)
lm(signed_rank(y) ~ 1) instead of wilcox.test(y)
The results are identical for t.test and highly similar for Wilcoxon. The images show results when N=50. 3/n


I show that this applies to one-sample t, Wilcoxon signed-rank, paired-sample t, Wilcoxon matched pairs, two-sample t, Mann-Whitney U, Welch's t, ANOVAs, Kruskal-Wallis, ANCOVA, Chi-square and goodness-of-fit. With working code examples. 4/n
This also means that students only need learn three (parametric) assumptions: (1) independence, (2) normal residuals, and (3) homoscedasticity. These apply to all the tests/models, including the non-parametric. So simple, no zoo, no rote learning, a better understanding. 5/n

But whoa, did I just go parametric on non-parametric tests!? Yes, for beginners it's much better to think "ranks!" and be a tiny bit off than to think "magically no assumptions" and resort to just-so rituals. It's also the approach taken by @JASPStats 6/n
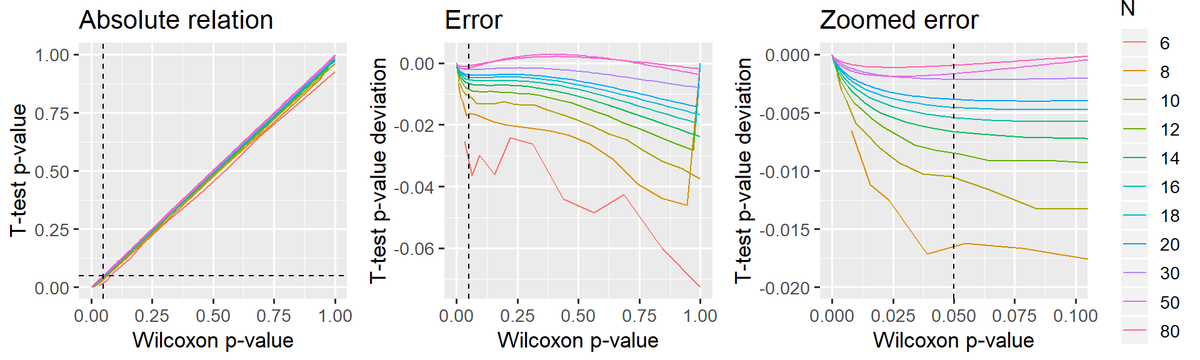
(For the geeks: here is the p-value error of this "linear Wilcoxon" as a function of sample size. Larger samples --> better approximation. See more at lindeloev.github.io/tests-as-linea…. I'm a Bayesian myself, but this is a convenient little test.) 7/n
I'll go through each test/model now. But first, this is all on Github: github.com/lindeloev/test…. Let's collaborate to make this awesome! Please submit more examples, correct errors, improve the communication, etc. 8/n
Paired samples t-test is just a "(one) mean pairwise difference" model: lm(y2 - y1 ~ 1) instead of t.test(y1, y2, paired=TRUE).
It's a "one mean" model of differences. 9/n
It's a "one mean" model of differences. 9/n

Wilcoxon matched pairs is the same, just with signed rank of the pairwise differences: lm(signed_rank(y2 - y1) ~ 1) instead of wilcox.test(y1, y2, paired=TRUE) 10/n

How about the "mean difference" model aka two-sample t-test? lm(y ~ 1 + group) instead of t.test(y1, y2, var.equal=TRUE). 11/n

Or the "mean rank difference" model aka Mann-Whitney U? lm(rank(y) ~ 1 + group) instead of wilcox.test(y1, y2). 12/n

Here "group" is an *indicator variable* aka *dummy coded*. It's 0 for the first group (so y1 ~ 1) and 1 for the second group (so y2 ~ 1 + difference). This makes the slope equal the difference. Now we can model categorical differences using lines! All set to do AN(C)OVAs. 13/n

That was the hard part. Well done. Here's a cute cat video as an intermediate reward. 14/n
One-way ANOVA is a "difference to the first mean" model. Just the two-sample model with more than one indicator.
Kruskal-Wallis is the same, just on ranks: lm(rank(y) ~ 1 + ...). 15/n
Kruskal-Wallis is the same, just on ranks: lm(rank(y) ~ 1 + ...). 15/n

Baby steps are required to extend this to one-way ANCOVAs and two-way AN(C)OVAs. Goodness-of-fit is just a log-linear one-way ANOVA and Chi-Square is just a log-linear two-way ANOVA. Can be done in lm and glm. Check the cheat sheet and the extended doc for worked examples. 16/n
Pearson correlation is the good old y = ax + b, i.e., intercept + slope. lm(y ~ 1 + x). Though scale x and y to SD=1 to recover correlation coefficient.
Spearman? Same but ranked, as always: lm(rank(y) ~ 1 + rank(x)). 17/n
Spearman? Same but ranked, as always: lm(rank(y) ~ 1 + rank(x)). 17/n

At this point, students know how to build parametric and "non-parametric" models using only intercepts, slopes, differences, and interactions. Students can also deduce their assumptions. Instead of just having rote-learned a test-zoo, they've learned modeling. 18/n
Add the concept of residual structures and they've learned mixed models and can come up with RM-ANOVA on their own. Add link functions and error distributions and we've got GLMM. You can do prediction intervals and go Bayesian for the whole lot. 19/n

OK, sorry, I got carried away there. One tweet left. 20/n
Students will eventually need to learn the terms "t-test" etc. to communicate concisely. But now they have a deep understanding and a structure to relate these to. Here's the cheat sheet and worked examples again: lindeloev.github.io/tests-as-linea… END
This was inspired by posts and books by Thom Bagulay (@seriousstats), Christoph Scheepers, Russ Poldrack (@russpoldrack), Kristoffer Magnusson (@krstoffr), Phillip Alday, Jeff Rouder (@JeffRouder), Andy Field (@ProfAndyField), Johnny van Doorn, and more. See links in the doc. TY!