I am going to read a book about chart patterns. I will share some patterns and their concepts in this thread.
I hope this will help you to increase your knowledge. 😊😇
So let's start #Megathread_ChartPatterns
I hope this will help you to increase your knowledge. 😊😇
So let's start #Megathread_ChartPatterns
Day 1 Dt 12 July
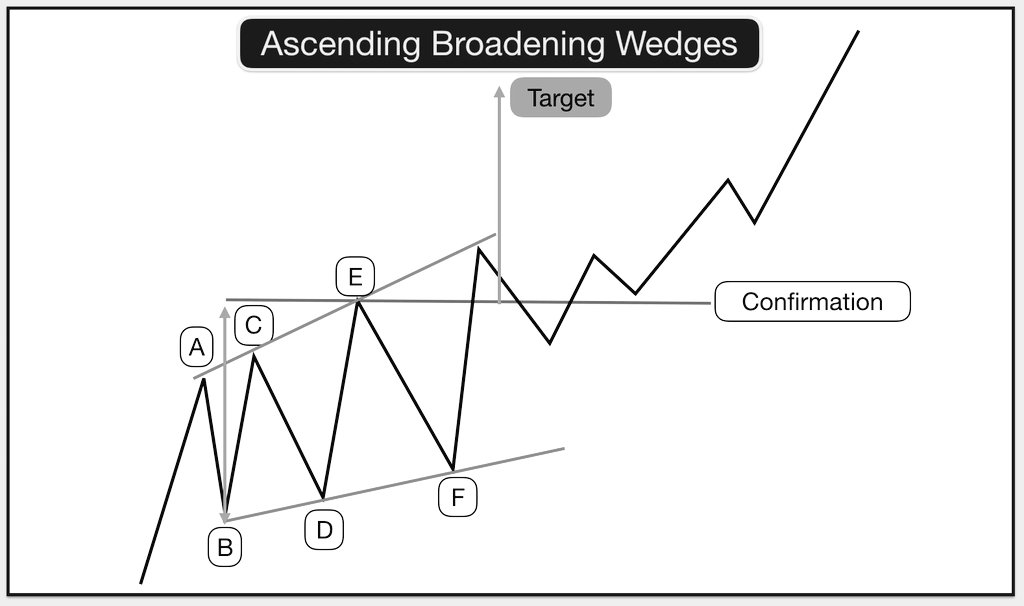
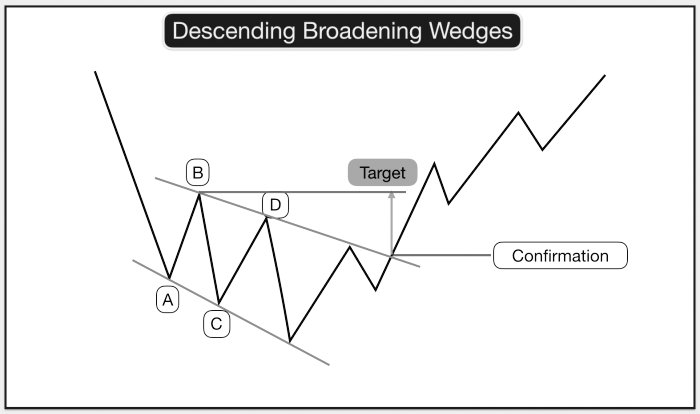
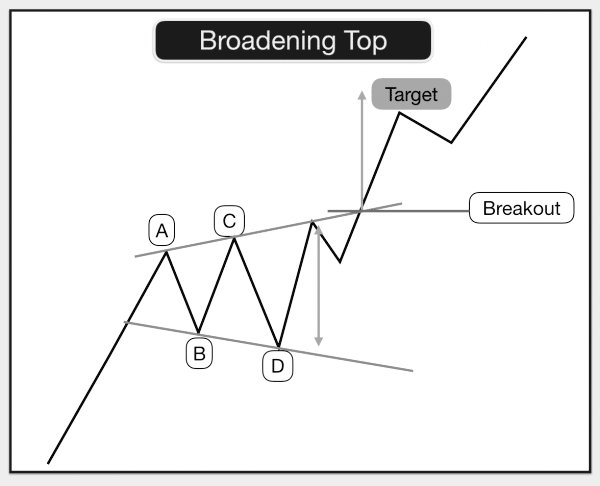
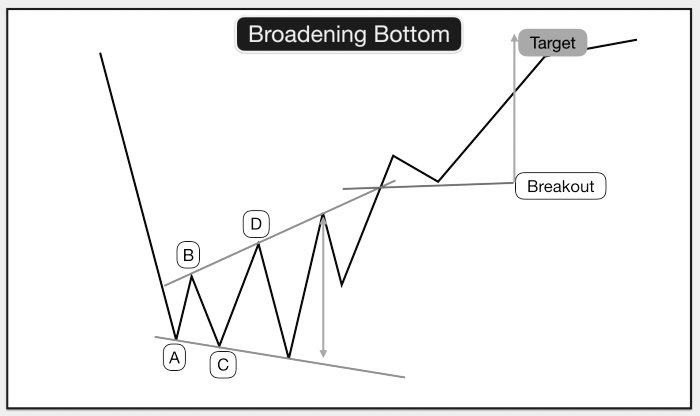
👉Types of #Broadening_Patters
- Ascending/Descending
-Top/Bottom
👉Identifying patterns
-Shape wid HH & LL.
-Prices follow 2 trend lines top one slopes up & the bottom 1 slopes down.
-Touches, Should've at least 2 highs & 2 lows,
#Megathread_ChartPatterns
👉Types of #Broadening_Patters
- Ascending/Descending
-Top/Bottom
👉Identifying patterns
-Shape wid HH & LL.
-Prices follow 2 trend lines top one slopes up & the bottom 1 slopes down.
-Touches, Should've at least 2 highs & 2 lows,
#Megathread_ChartPatterns
Day2
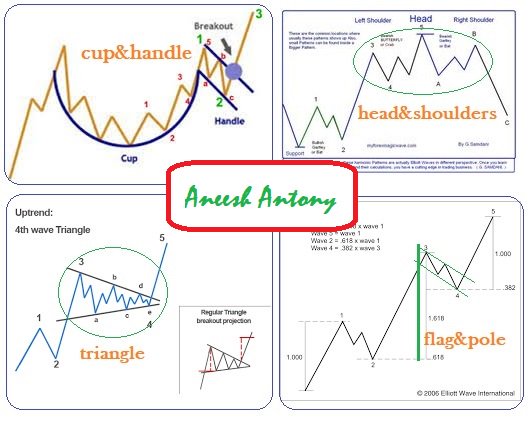
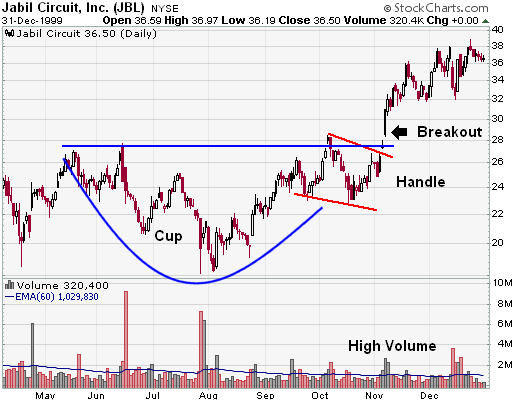
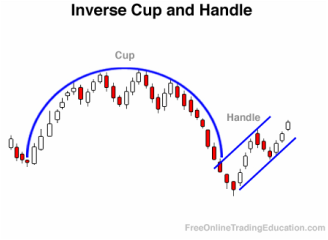
Types of #CupWithHandle_Pattern
-Bullish/Bearish cup
Identifying
-The cup should be “U” shaped
-Handles form in upper half of cup
-Cup lips near same price
-There s'ld be a substantial increase in vol on breakout resistance.
#Megathread_ChartPatterns
Types of #CupWithHandle_Pattern
-Bullish/Bearish cup
Identifying
-The cup should be “U” shaped
-Handles form in upper half of cup
-Cup lips near same price
-There s'ld be a substantial increase in vol on breakout resistance.
#Megathread_ChartPatterns
Day3
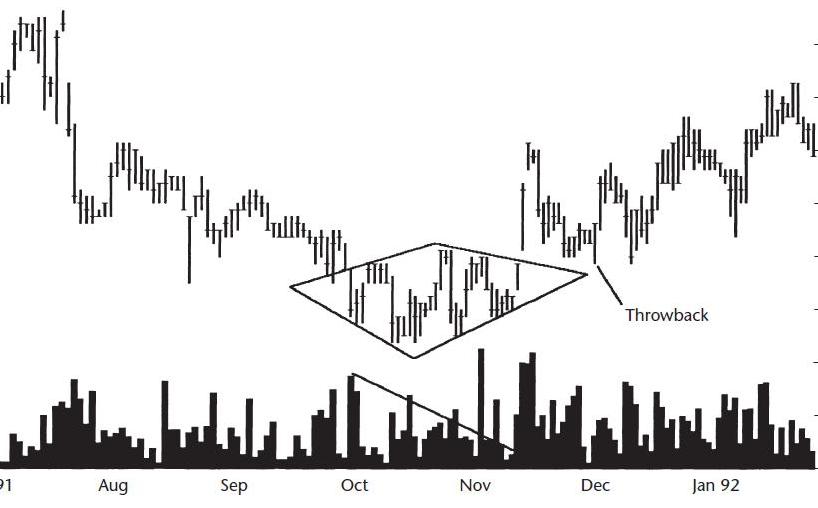
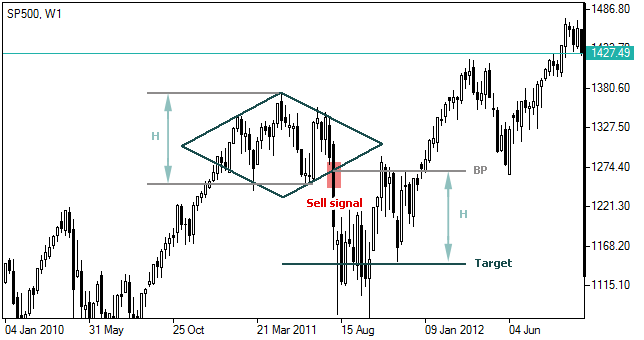
#Diamond_Bottom_pattern forms after a downward
price trend.
Identification
-Prices form higher highs and lower lows in the first part of the
pattern then lower highs and higher lows. (See Img 4 dtls)
#Diamond_Bottom have low break-even failure rate
#Megathread_ChartPatterns
#Diamond_Bottom_pattern forms after a downward
price trend.
Identification
-Prices form higher highs and lower lows in the first part of the
pattern then lower highs and higher lows. (See Img 4 dtls)
#Diamond_Bottom have low break-even failure rate
#Megathread_ChartPatterns
Day4
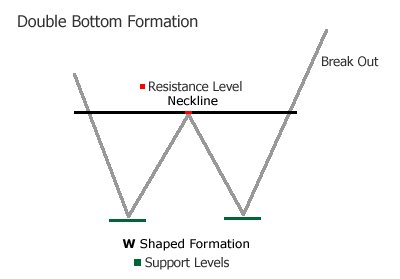
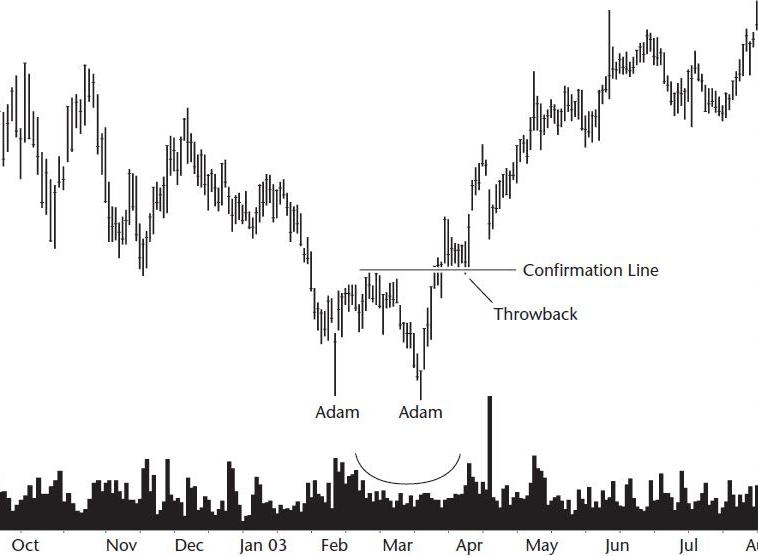
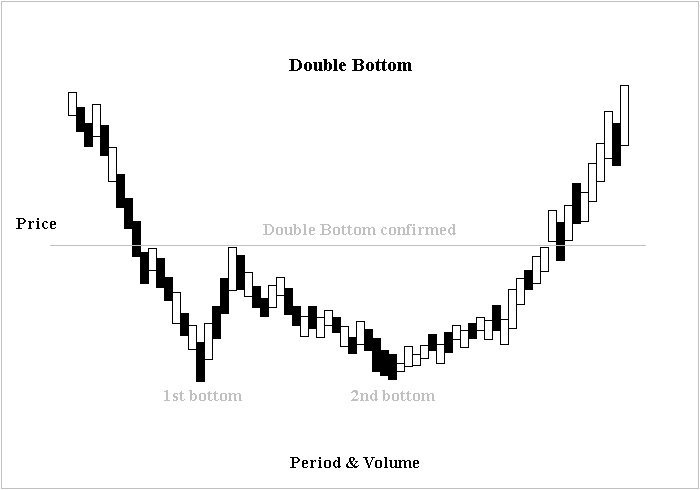
#Double_Bottom_Adam2
Identification
-Narrow/V-shaped Bottom,1day spikes
-Vol:Usually higher on d left bottom thn d right
-The highest high between the 2 bottoms. A close above d confirmtion point is d breakout & confirms d pattern as a valid bottom
#Megathread_ChartPatterns
#Double_Bottom_Adam2
Identification
-Narrow/V-shaped Bottom,1day spikes
-Vol:Usually higher on d left bottom thn d right
-The highest high between the 2 bottoms. A close above d confirmtion point is d breakout & confirms d pattern as a valid bottom
#Megathread_ChartPatterns
Day5
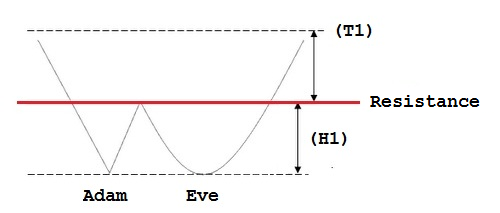
#Double_Bottom_Adam_n_Eve Breakout is upward.
Identification
-DB, Narrow, V-shaped, left bottom (Adam) 1/2 day spike. The right (Eve) appears rounded & wider
-lower right bottom perform better
-volume heavier on the left bottom than on the right.
#Megathread_ChartPatterns
#Double_Bottom_Adam_n_Eve Breakout is upward.
Identification
-DB, Narrow, V-shaped, left bottom (Adam) 1/2 day spike. The right (Eve) appears rounded & wider
-lower right bottom perform better
-volume heavier on the left bottom than on the right.
#Megathread_ChartPatterns
Day6
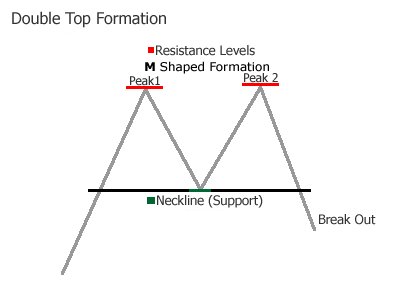
#Double_Top_Adam2 Short-term bearish reversal
Identification
-top narrow price spikes, inverted V’s. Both should appear similar
-VOL:higher on d left but vol. trends downward frm peak2peak
-Confirmation is a close below d LL between the 2tops
#Megathread_ChartPatterns
#Double_Top_Adam2 Short-term bearish reversal
Identification
-top narrow price spikes, inverted V’s. Both should appear similar
-VOL:higher on d left but vol. trends downward frm peak2peak
-Confirmation is a close below d LL between the 2tops
#Megathread_ChartPatterns
Day7
#DoubleBottom_Eve2 bullish reversal
Identification
-Prices trend downward 2 d pattern & shouldn't drift below d left bottom
-Eve bottoms R wide, rounded turns, not narrow price spikes, not V shaped.
-Vol:Usually higher on the left bottom than right
#Megathread_ChartPatterns
#DoubleBottom_Eve2 bullish reversal
Identification
-Prices trend downward 2 d pattern & shouldn't drift below d left bottom
-Eve bottoms R wide, rounded turns, not narrow price spikes, not V shaped.
-Vol:Usually higher on the left bottom than right
#Megathread_ChartPatterns
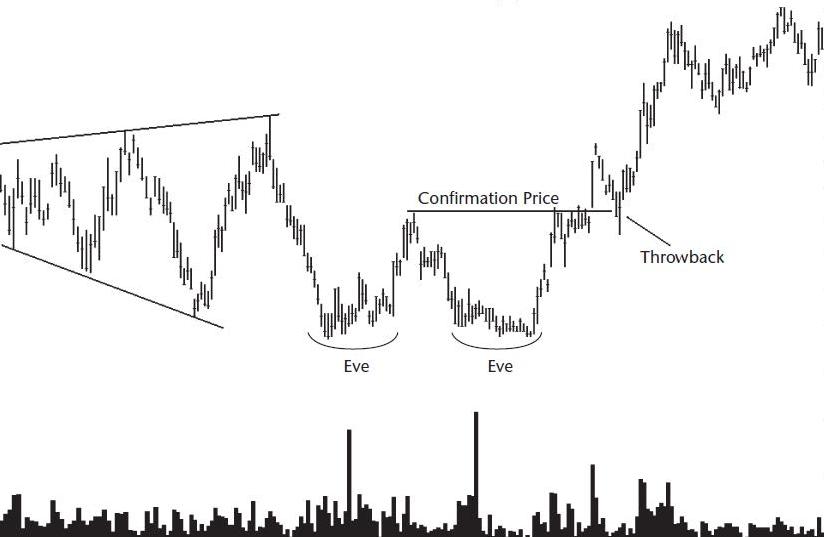
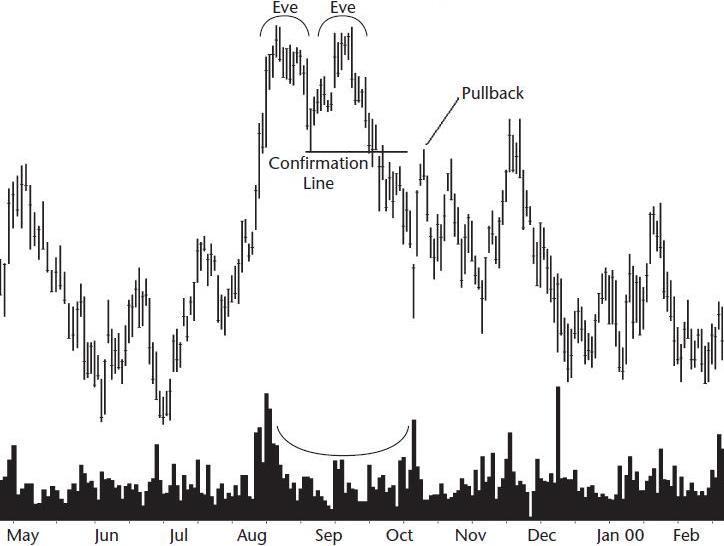
Day8
#DoubleTop_Eve2
-short-term bearish reversal
Identification
-2 peaks at about the same price level
-Both Eve peaks should appear rounded and wide, not made of a single, narrow price spike.
-Vol:Usually higher on the left bottom than right
#Megathread_ChartPatterns
#DoubleTop_Eve2
-short-term bearish reversal
Identification
-2 peaks at about the same price level
-Both Eve peaks should appear rounded and wide, not made of a single, narrow price spike.
-Vol:Usually higher on the left bottom than right
#Megathread_ChartPatterns
Day9
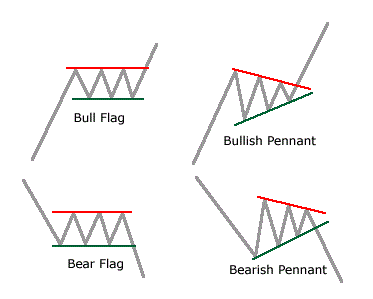
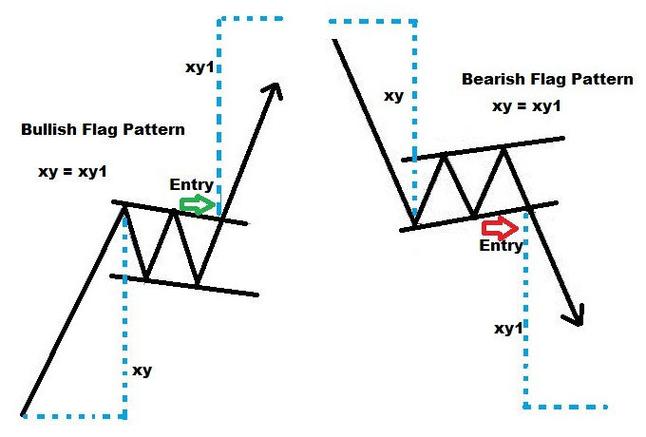
#Flags
-Short-term bullish/Bearish continuation
Identification
-2 parallel trend lines bound the price
-Vol: usually trends downward throughout the formation
#Megathread_ChartPatterns
#Flags
-Short-term bullish/Bearish continuation
Identification
-2 parallel trend lines bound the price
-Vol: usually trends downward throughout the formation
#Megathread_ChartPatterns
Day10
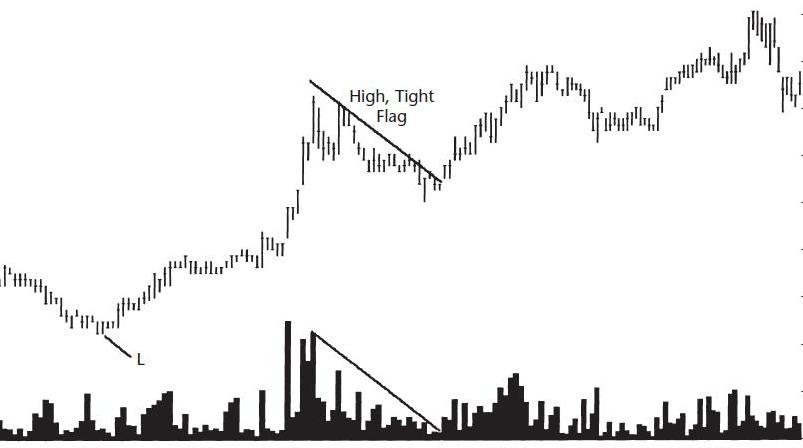
#Flags-#High_n_Tight
-Short-term bullish continuation
Identification
-Locate a consolidation area, where prices pause in the prevailing uptrend near where price doubles from the trend start.
-Select patterns with a falling volume trend & U shape
#Megathread_ChartPatterns
#Flags-#High_n_Tight
-Short-term bullish continuation
Identification
-Locate a consolidation area, where prices pause in the prevailing uptrend near where price doubles from the trend start.
-Select patterns with a falling volume trend & U shape
#Megathread_ChartPatterns
Day11
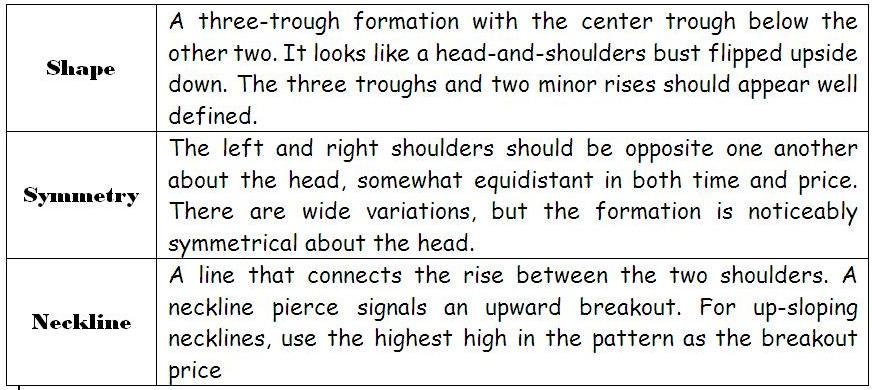
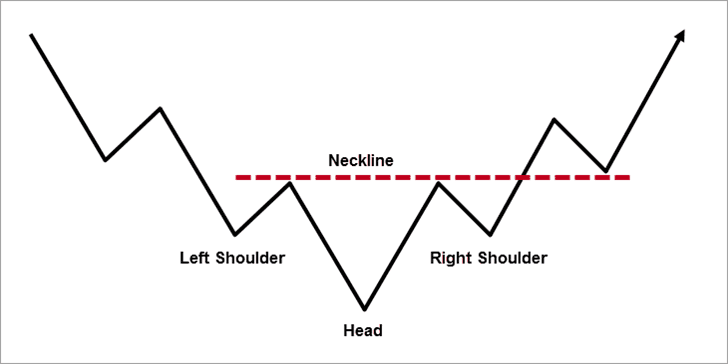
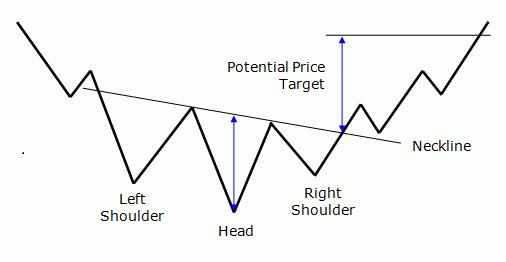
#Head_and_Shoulders_Bottoms
-Short-term bullish reversal
Identification
-see img for details.
-Tall & narrow pattern perform better than do their short & wide counterparts.
(All rights belong to their respective owners)
#Megathread_ChartPatterns
#Head_and_Shoulders_Bottoms
-Short-term bullish reversal
Identification
-see img for details.
-Tall & narrow pattern perform better than do their short & wide counterparts.
(All rights belong to their respective owners)
#Megathread_ChartPatterns
D12
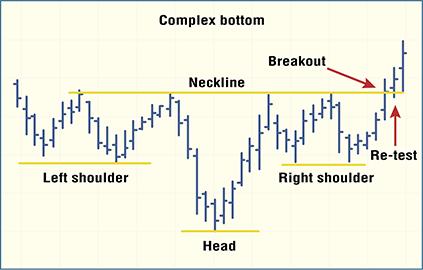
#Complex H&Sb
-Short bullish reversal
Id
-A CH&SB wid multiple shoulders,multiple heads or both
-The shoulder should bottom near d same price, b nearly d same distance frm d head & look similar
-brkout:when price closes above d down sloping neckline
#Megathread_ChartPatterns
#Complex H&Sb
-Short bullish reversal
Id
-A CH&SB wid multiple shoulders,multiple heads or both
-The shoulder should bottom near d same price, b nearly d same distance frm d head & look similar
-brkout:when price closes above d down sloping neckline
#Megathread_ChartPatterns
Day13
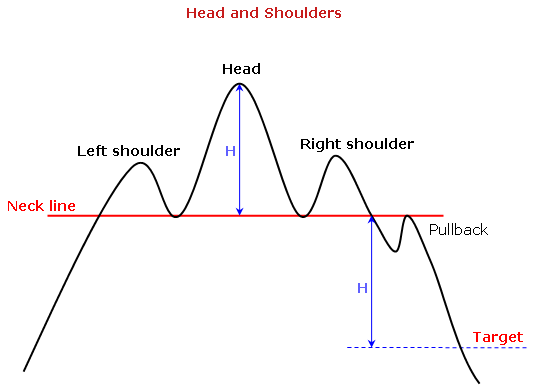
#Head_and_Shoulders_Top
-ShortTerm BearishReversal
Identification
-The H&S top usually appears @ d end of a long uptrend
-A 3-trough formation with d center though above the other 2
-The 2 shoulders appear @ same price level
-Downward breakout
#Megathread_ChartPatterns
#Head_and_Shoulders_Top
-ShortTerm BearishReversal
Identification
-The H&S top usually appears @ d end of a long uptrend
-A 3-trough formation with d center though above the other 2
-The 2 shoulders appear @ same price level
-Downward breakout
#Megathread_ChartPatterns
Day14
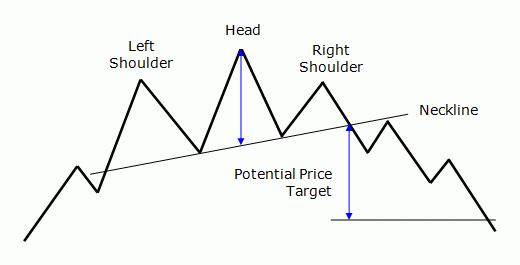
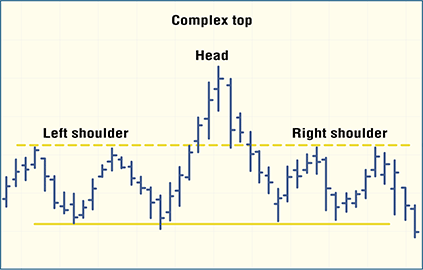
#Complex H&STop
-Short BearishReversal
Identification
-A CH&ST with multiple shoulders,multiple heads or both
-The head is higher than d shoulders
-The neckline joins d lower lows from left 2 ri8 shoulders
-brkout:when price closes below neckline.
#Megathread_ChartPatterns
#Complex H&STop
-Short BearishReversal
Identification
-A CH&ST with multiple shoulders,multiple heads or both
-The head is higher than d shoulders
-The neckline joins d lower lows from left 2 ri8 shoulders
-brkout:when price closes below neckline.
#Megathread_ChartPatterns
Day15
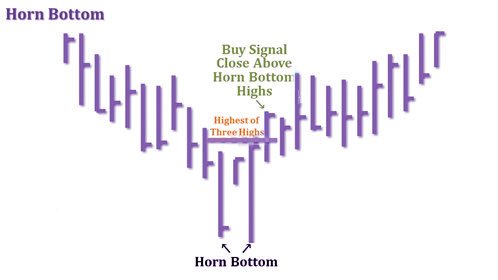
#Horn_Bottoms
-Short term bullish reversal
-Horns are visible on weekly charts
-It should mark the turning point of a downward price trend
-The pattern becomes a valid horn bottom when price closes above the highest high in the 3-week pattern.
#Megathread_ChartPatterns
#Horn_Bottoms
-Short term bullish reversal
-Horns are visible on weekly charts
-It should mark the turning point of a downward price trend
-The pattern becomes a valid horn bottom when price closes above the highest high in the 3-week pattern.
#Megathread_ChartPatterns
Day16
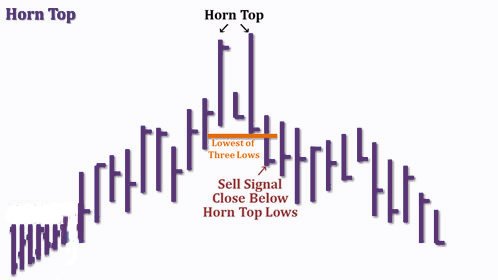
#Horn_Tops
-Short term bearish reversal
-Use the weekly chart to facilitate identification
-Confirmation occurs when price closes below the LL in the chart pattern.
-Pullbacks are rare for horns
#Megathread_ChartPatterns
#Horn_Tops
-Short term bearish reversal
-Use the weekly chart to facilitate identification
-Confirmation occurs when price closes below the LL in the chart pattern.
-Pullbacks are rare for horns
#Megathread_ChartPatterns
Day17
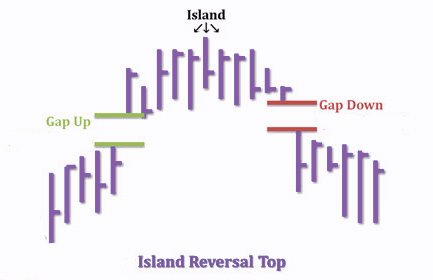
#Island_reversal_top
-Downward Breakouts
-Short term bearish reversal
-price separated by a gap up and then gap down
-The gaps appear at or near the same price level but are typically not the same size.
-Volume is usually high on the breakout day
#Megathread_ChartPatterns
#Island_reversal_top
-Downward Breakouts
-Short term bearish reversal
-price separated by a gap up and then gap down
-The gaps appear at or near the same price level but are typically not the same size.
-Volume is usually high on the breakout day
#Megathread_ChartPatterns
Day18
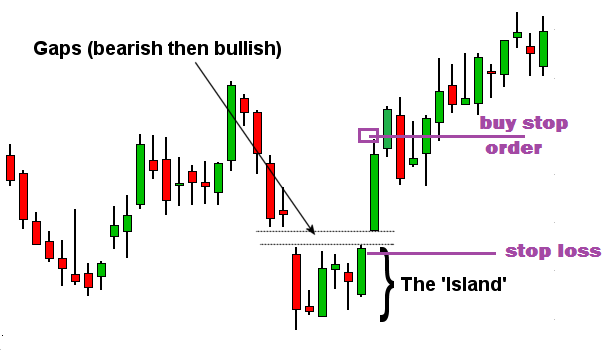
#Island_reversal_Bottom
-Upward Breakouts
-price separated first by a gap down and then gap up
-Select tall or wide patterns in a bull market, narrow ones in a bear market
-Trade with the general market trend: upward breakouts in a bull market
#Megathread_ChartPatterns
#Island_reversal_Bottom
-Upward Breakouts
-price separated first by a gap down and then gap up
-Select tall or wide patterns in a bull market, narrow ones in a bear market
-Trade with the general market trend: upward breakouts in a bull market
#Megathread_ChartPatterns
Day19
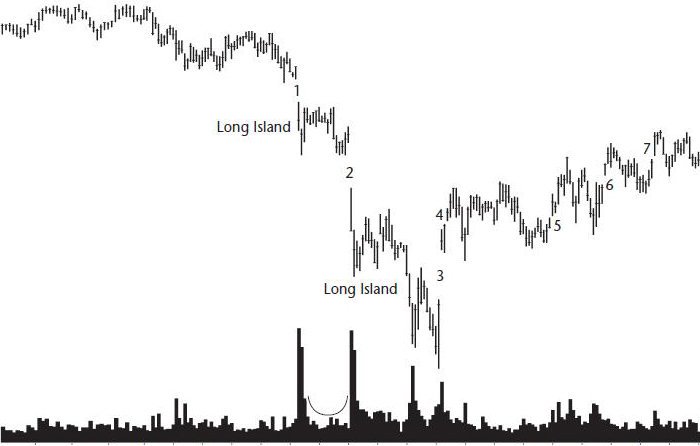
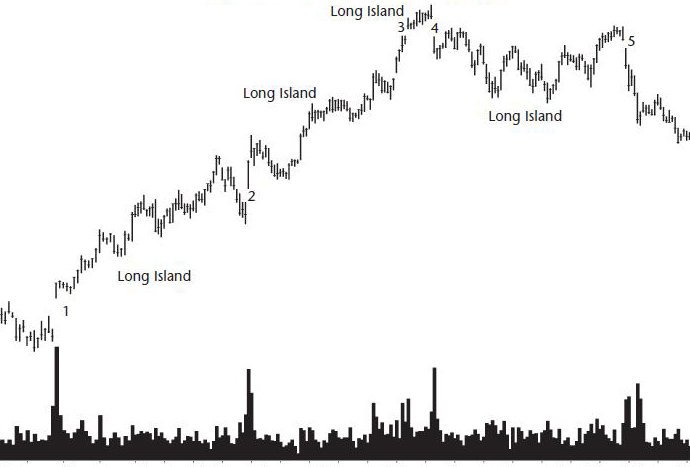
#Island_Long
-Long islands r continuation pattern
-2 gaps with different price
-Gaps should b long n wide,Avoid short
-large price gaps mean better performance
-Tall patterns perform better than short
-day after the 2nd gap is the breakout day
#Megathread_ChartPatterns
#Island_Long
-Long islands r continuation pattern
-2 gaps with different price
-Gaps should b long n wide,Avoid short
-large price gaps mean better performance
-Tall patterns perform better than short
-day after the 2nd gap is the breakout day
#Megathread_ChartPatterns
Day20
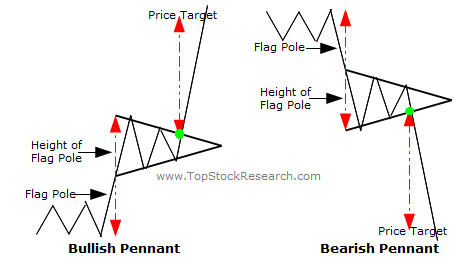
#Pennants
-Bullish/Bearish Pennants
-Bullish:It is formed in an uptrend
-Bearish: It is formed in an downtrend
-Pennants r 4 swing traders, not 4 investors
-price is consolidated between the 2 tapering converging trend line forming triangle pennant, b4 d pattern continues
#Pennants
-Bullish/Bearish Pennants
-Bullish:It is formed in an uptrend
-Bearish: It is formed in an downtrend
-Pennants r 4 swing traders, not 4 investors
-price is consolidated between the 2 tapering converging trend line forming triangle pennant, b4 d pattern continues
Day21
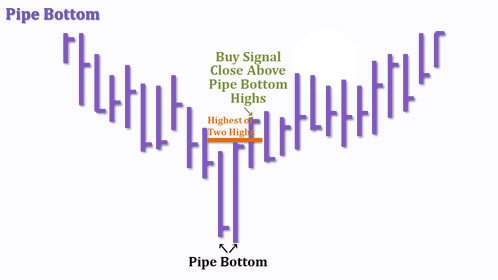
#Pips_Bottom
-ShortTermBullishReversal
-downward price spikes on weekly chart
-Locate 2 downward price spikes that r next to each other
-Brkout-when price closes above the highest high in the pattern
-Pipes do best when d volume trend is downward
#Megathread_ChartPatterns
#Pips_Bottom
-ShortTermBullishReversal
-downward price spikes on weekly chart
-Locate 2 downward price spikes that r next to each other
-Brkout-when price closes above the highest high in the pattern
-Pipes do best when d volume trend is downward
#Megathread_ChartPatterns
Day22
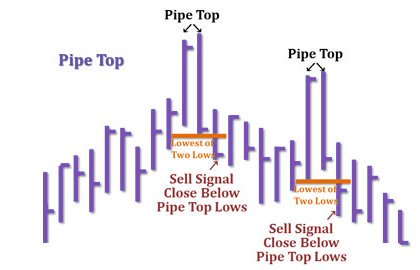
#Pips_Top
-Short Term Bearish Reversal
-Downward Breakouts
-easy to spot on weekly chart
-Brkout-when price closes below the LL in the pattern
-Always wait for price to confirm the pattern, that is price
must close below the lowest low
#Megathread_ChartPatterns
#Pips_Top
-Short Term Bearish Reversal
-Downward Breakouts
-easy to spot on weekly chart
-Brkout-when price closes below the LL in the pattern
-Always wait for price to confirm the pattern, that is price
must close below the lowest low
#Megathread_ChartPatterns
Day23
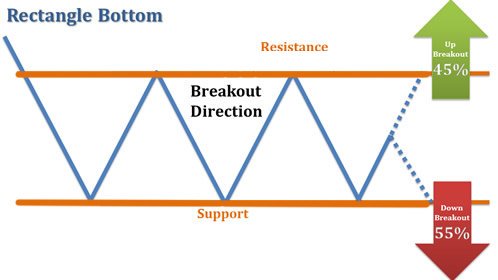
#Rectangle_Bottom
-Bullish Rev/Bearish Continuation
-Prices trend down to the formation & then oscillate between 2 horizontal lines
-Downward price trend
-Atleast 2 touches of each trend line r required for a valid rectangle
-Vol. usually downward
#Megathread_ChartPatterns
#Rectangle_Bottom
-Bullish Rev/Bearish Continuation
-Prices trend down to the formation & then oscillate between 2 horizontal lines
-Downward price trend
-Atleast 2 touches of each trend line r required for a valid rectangle
-Vol. usually downward
#Megathread_ChartPatterns
Day24
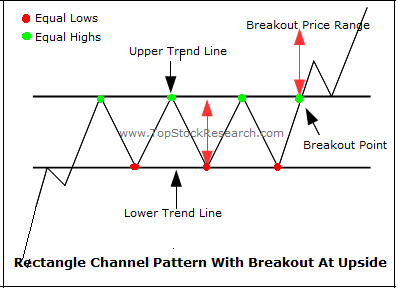
#Rectangle_Top
-Rising Prices trend & oscillate between 2 horizontal lines
- required Atleast 2 touches of each trendline
-Horizontal Upper line act as Ress & lower line act as a Supp
-If rectangle is tall enough, 1 can do scalping between T lines
#Megathread_ChartPatterns
#Rectangle_Top
-Rising Prices trend & oscillate between 2 horizontal lines
- required Atleast 2 touches of each trendline
-Horizontal Upper line act as Ress & lower line act as a Supp
-If rectangle is tall enough, 1 can do scalping between T lines
#Megathread_ChartPatterns
Day25
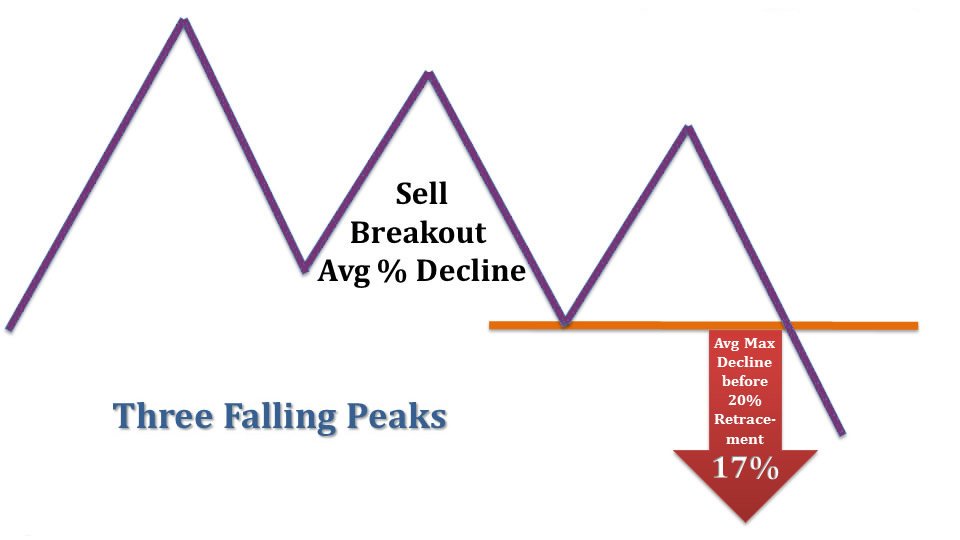
#ThreeFallingPeaks
-bearish reversal
-3 peaks need not follow a straight down-sloping trend line
-The 3 peaks should appear similar in size & shape
-The pattern becomes valid when price closes below the
LL
-Be4 trading, check support zones
#Megathread_ChartPatterns
#ThreeFallingPeaks
-bearish reversal
-3 peaks need not follow a straight down-sloping trend line
-The 3 peaks should appear similar in size & shape
-The pattern becomes valid when price closes below the
LL
-Be4 trading, check support zones
#Megathread_ChartPatterns
Day26
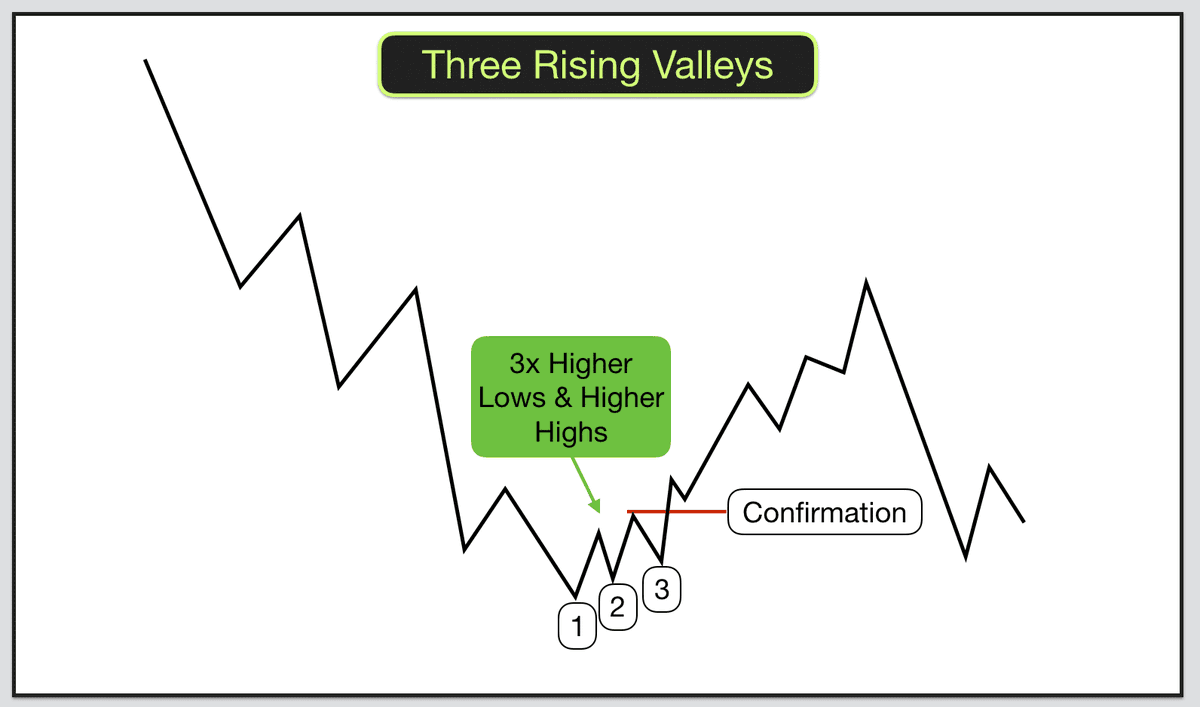
#ThreeRisingValleys
-bullish reversal
-Look for 3minor lows in a row, usually found in an uptrend
-this pattern is quite good in bull market
-Confrm-when price closes above the HH in the pattern
-1 can also use a down-sloping trend line
#Megathread_ChartPatterns
#ThreeRisingValleys
-bullish reversal
-Look for 3minor lows in a row, usually found in an uptrend
-this pattern is quite good in bull market
-Confrm-when price closes above the HH in the pattern
-1 can also use a down-sloping trend line
#Megathread_ChartPatterns
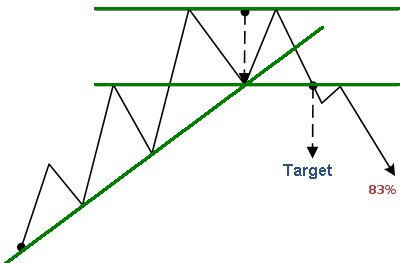
Day27
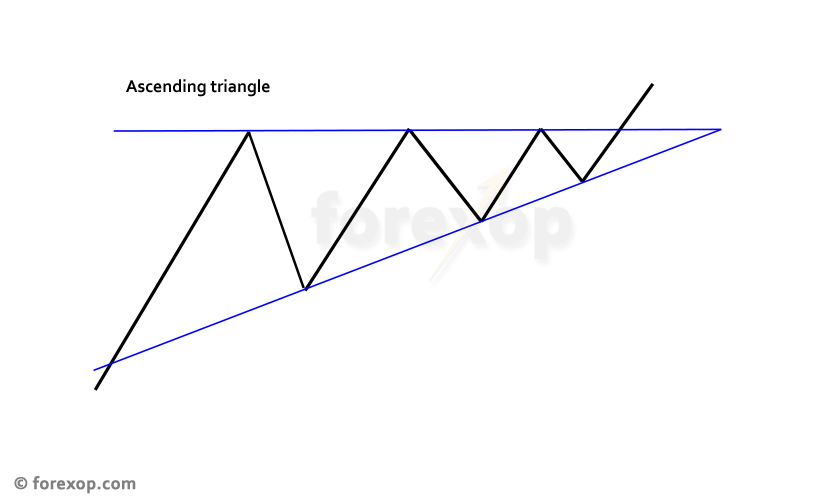
#Triangles_Ascending
-2trend lines-top1 horizontal & bottom1 sloping up
form a triangle pattern
-Prices rise up to & fall away from horizontal line at least twice
-Prices decline 2 & rise away from an upsloping line
-premature breakout is possible
#Megathread_ChartPatterns
#Triangles_Ascending
-2trend lines-top1 horizontal & bottom1 sloping up
form a triangle pattern
-Prices rise up to & fall away from horizontal line at least twice
-Prices decline 2 & rise away from an upsloping line
-premature breakout is possible
#Megathread_ChartPatterns
Day28
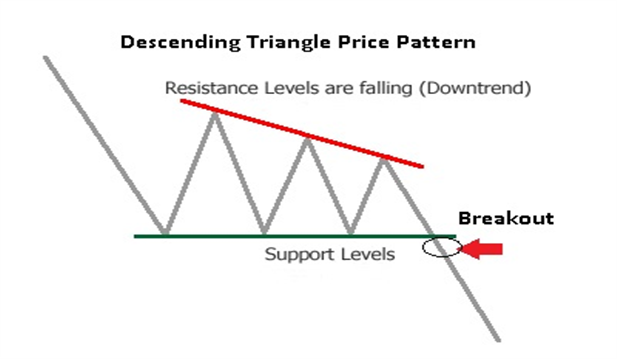
#Triangles_Descending
- Triangle shape with horizontal bottom & down sloping top
-Horizontal support line-A horizontal base acts to support prices
- Down sloping top trend line 1 can call resst. line
-Brkout confrm- Prices usually move down quickly
#Megathread_ChartPatterns
#Triangles_Descending
- Triangle shape with horizontal bottom & down sloping top
-Horizontal support line-A horizontal base acts to support prices
- Down sloping top trend line 1 can call resst. line
-Brkout confrm- Prices usually move down quickly
#Megathread_ChartPatterns
Day29
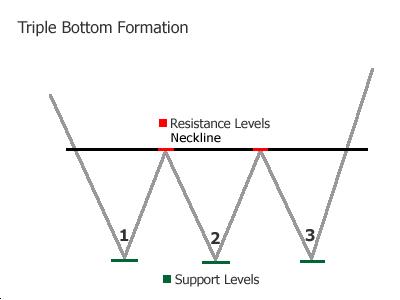
#Triple_Bottoms
-bullish reversal
-Three distinct minor lows at about the same price
-Narrow patterns perform better than wide
-usually large enough to be visible on weekly charts
-Confirmation:Price must rise above the HH in the formation
#Megathread_ChartPatterns
#Triple_Bottoms
-bullish reversal
-Three distinct minor lows at about the same price
-Narrow patterns perform better than wide
-usually large enough to be visible on weekly charts
-Confirmation:Price must rise above the HH in the formation
#Megathread_ChartPatterns
Day30
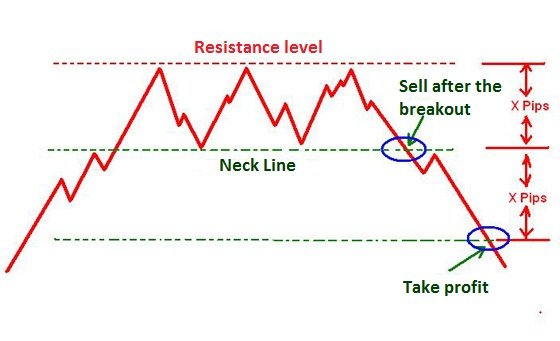
#Triple_Top
-bearish reversal
-3 tops should be near 1another in price
-Triple tops wid U-shaped vol perform best
-Prices must decline below the LL in d formation
-An upsloping trendline drawn connecting the valley lows can also serve as confrmtion
#Megathread_ChartPatterns
#Triple_Top
-bearish reversal
-3 tops should be near 1another in price
-Triple tops wid U-shaped vol perform best
-Prices must decline below the LL in d formation
-An upsloping trendline drawn connecting the valley lows can also serve as confrmtion
#Megathread_ChartPatterns
D31
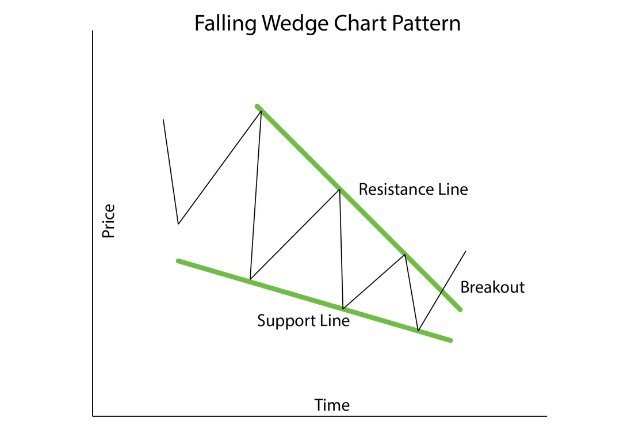
#Wedge_Falling
-Draw 2 trendlines, 1along the tops & 1along the bottoms
-pattrn creates several minor highs& minor lows
-min 5 touches necessary to a gud formation
-Vol usually downward until the breakout
-can breakout in any direction,wait 4 that
#Megathread_ChartPatterns
#Wedge_Falling
-Draw 2 trendlines, 1along the tops & 1along the bottoms
-pattrn creates several minor highs& minor lows
-min 5 touches necessary to a gud formation
-Vol usually downward until the breakout
-can breakout in any direction,wait 4 that
#Megathread_ChartPatterns
Day32
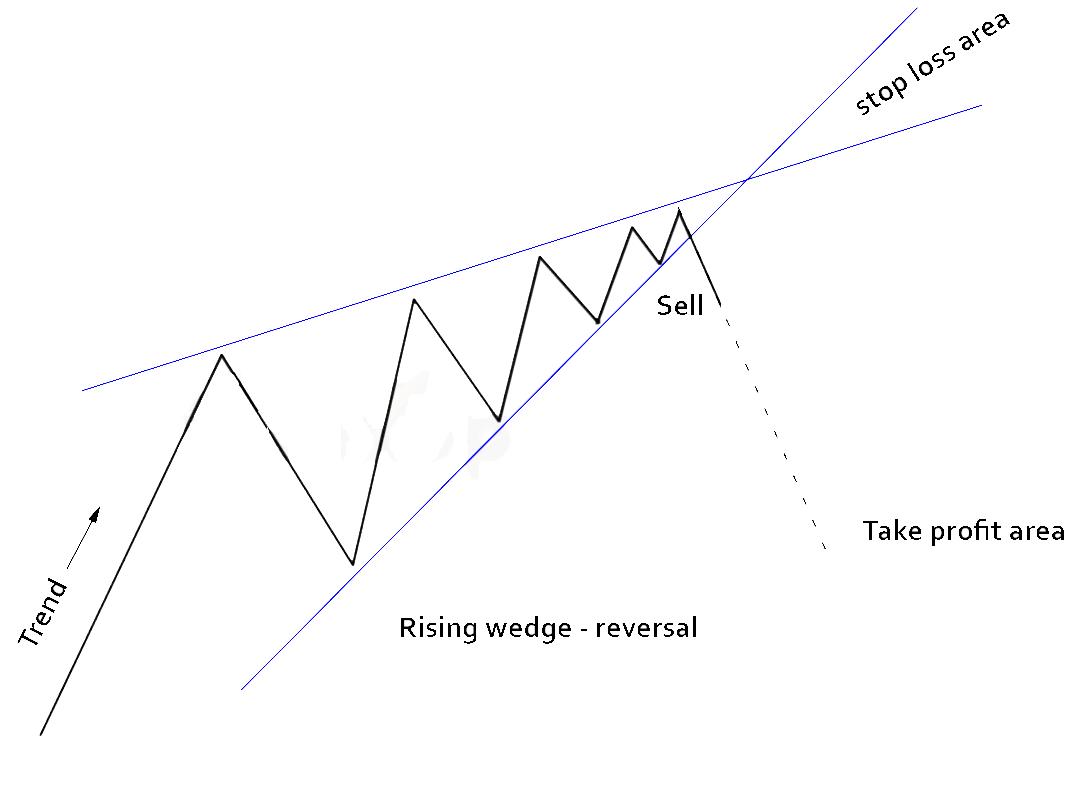
#Wedge_Rising
-Draw 2 trendlines
-resistance : upward sloping upper line
-support: upward sloping lower line
-both trendline should have a definite upward slope
-Wait for the breakout for successful trade
-if u missed, short after a pullback.
#Megathread_ChartPatterns
#Wedge_Rising
-Draw 2 trendlines
-resistance : upward sloping upper line
-support: upward sloping lower line
-both trendline should have a definite upward slope
-Wait for the breakout for successful trade
-if u missed, short after a pullback.
#Megathread_ChartPatterns
Day33
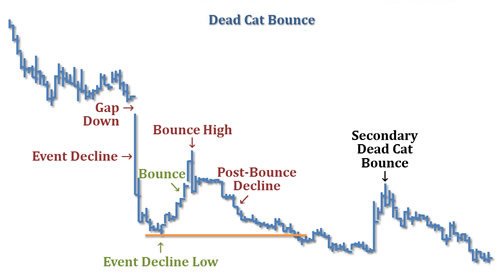
#Dead_Cat_Bounce
-The D high is below the prior day’s low, leaving a price gap on the chart
-usually On the negative news, price gaps down
-Prices bounce up, recovering much of what they lost during event decline
-Wait 4 d bounce 2 peak & then sell
#Megathread_ChartPatterns
#Dead_Cat_Bounce
-The D high is below the prior day’s low, leaving a price gap on the chart
-usually On the negative news, price gaps down
-Prices bounce up, recovering much of what they lost during event decline
-Wait 4 d bounce 2 peak & then sell
#Megathread_ChartPatterns