Profile picture
, 4 tweets, 2 min read Read on Twitter
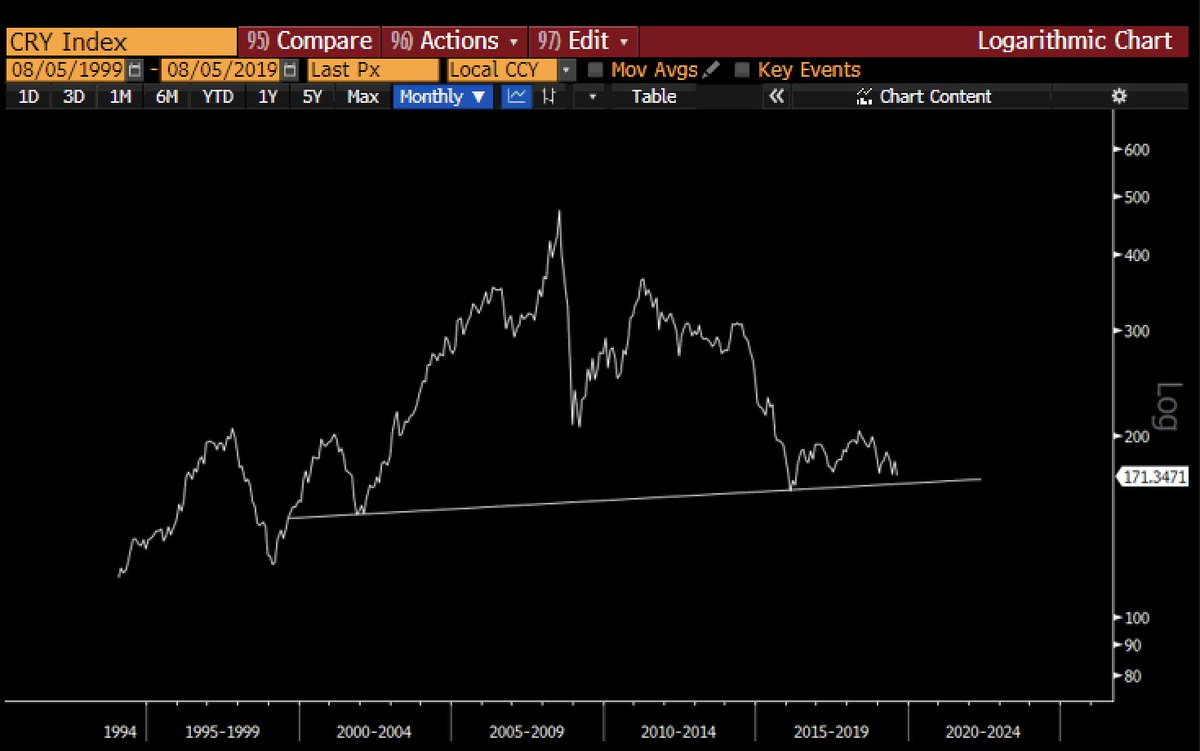
When I look at the long-term chart of the CRB Commodity Index, it really does have deflationary bust written all over it. We are around the key support (like so many other things - many of which have started breaking)...
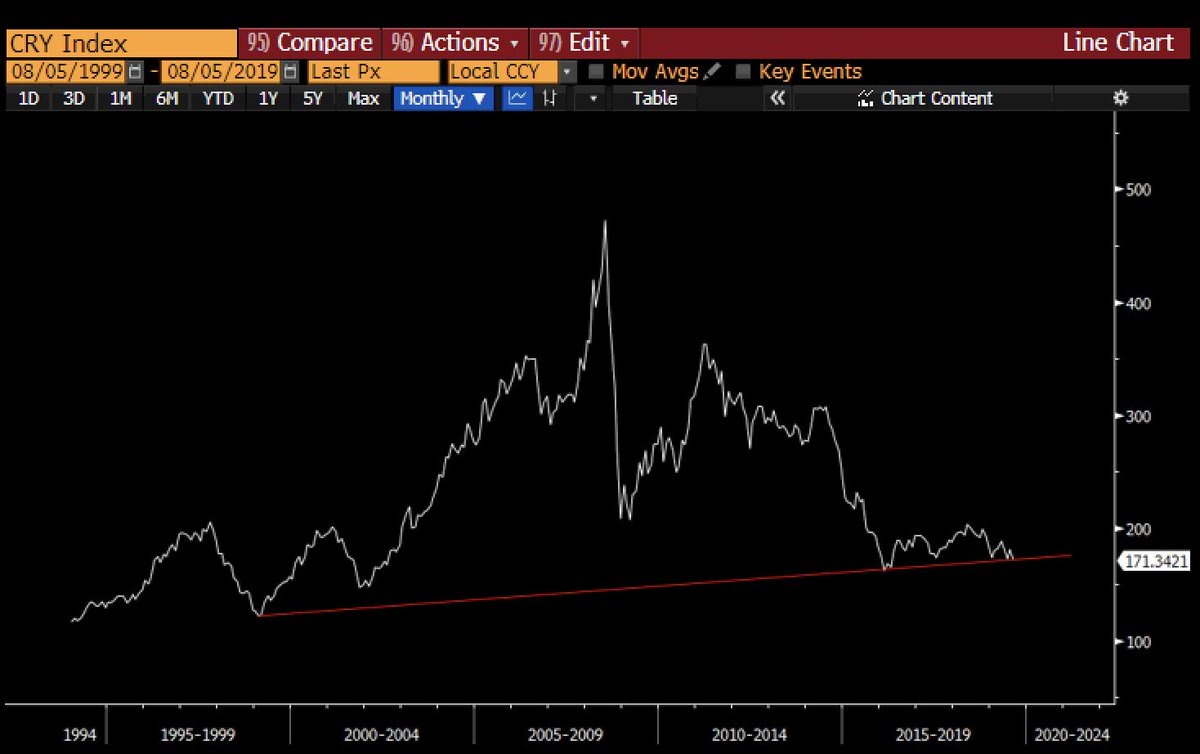
I know many of you like to see these HUGE charts in log scales, so here it is... it looks even worse... commodity prices can more than halve from here.
It's probably all down to this chart of the ADXY (Asian currency index) which has Asian currency crisis (dollar spike) written all over it and is the probably source of the deflation. It has broken down.
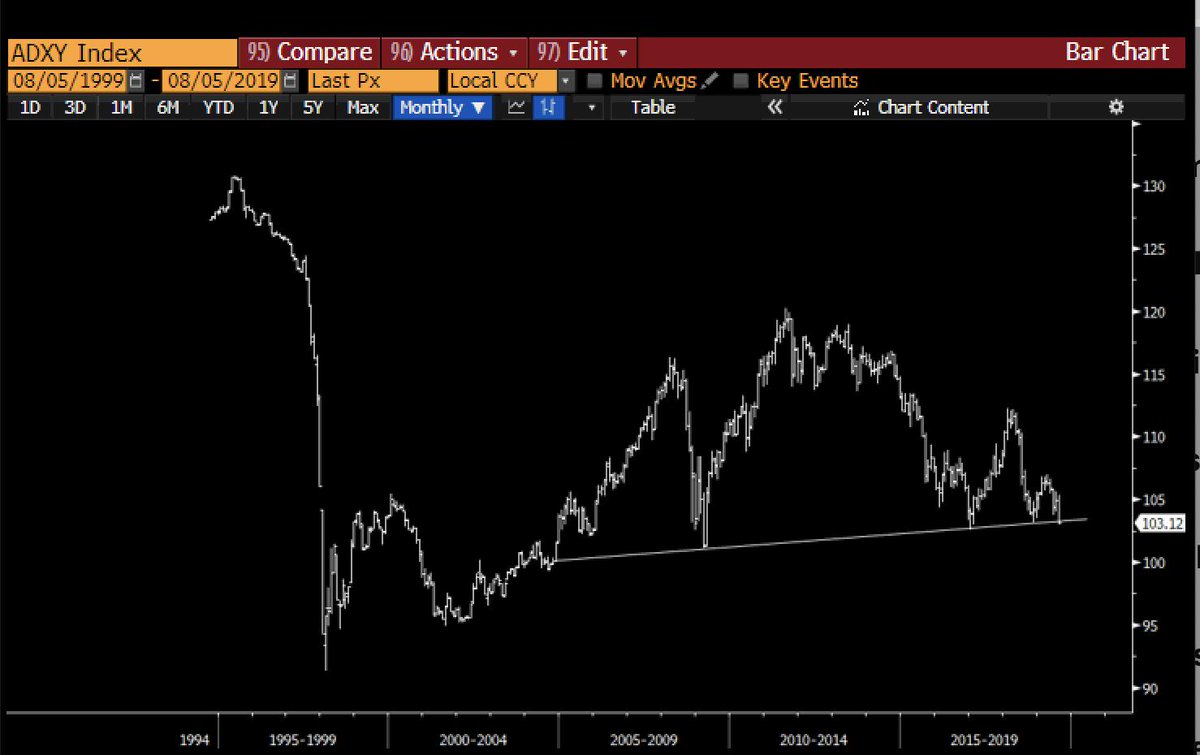
I can not stress how important this all is. Dollar strength is first going to kill EM but in the end it's going to kill the US. This is going to play out in its entirety over the coming 24 months, probably.
Missing some Tweet in this thread?
You can try to force a refresh.

Like this thread? Get email updates or save it to PDF!

Subscribe to Raoul Pal
Profile picture

Get real-time email alerts when new unrolls are available from this author!

This content may be removed anytime!

Twitter may remove this content at anytime, convert it as a PDF, save and print for later use!

Try unrolling a thread yourself!

how to unroll video

1) Follow Thread Reader App on Twitter so you can easily mention us!

2) Go to a Twitter thread (series of Tweets by the same owner) and mention us with a keyword "unroll" @threadreaderapp unroll

You can practice here first or read more on our help page!

Follow Us on Twitter!

Did Thread Reader help you today?

Support us! We are indie developers!


This site is made by just three indie developers on a laptop doing marketing, support and development! Read more about the story.

Become a Premium Member ($3.00/month or $30.00/year) and get exclusive features!

Become Premium

Too expensive? Make a small donation by buying us coffee ($5) or help with server cost ($10)

Donate via Paypal Become our Patreon

Thank you for your support!