,
16 tweets,
6 min read
Read on Twitter
THREAD
Which countries reduced their fossil CO₂ emissions the fastest (over a 10 year period), while still maintaining positive economic growth (& outside of economic crises)?
I am often asked this question, so let’s check the data…
Which countries reduced their fossil CO₂ emissions the fastest (over a 10 year period), while still maintaining positive economic growth (& outside of economic crises)?
I am often asked this question, so let’s check the data…
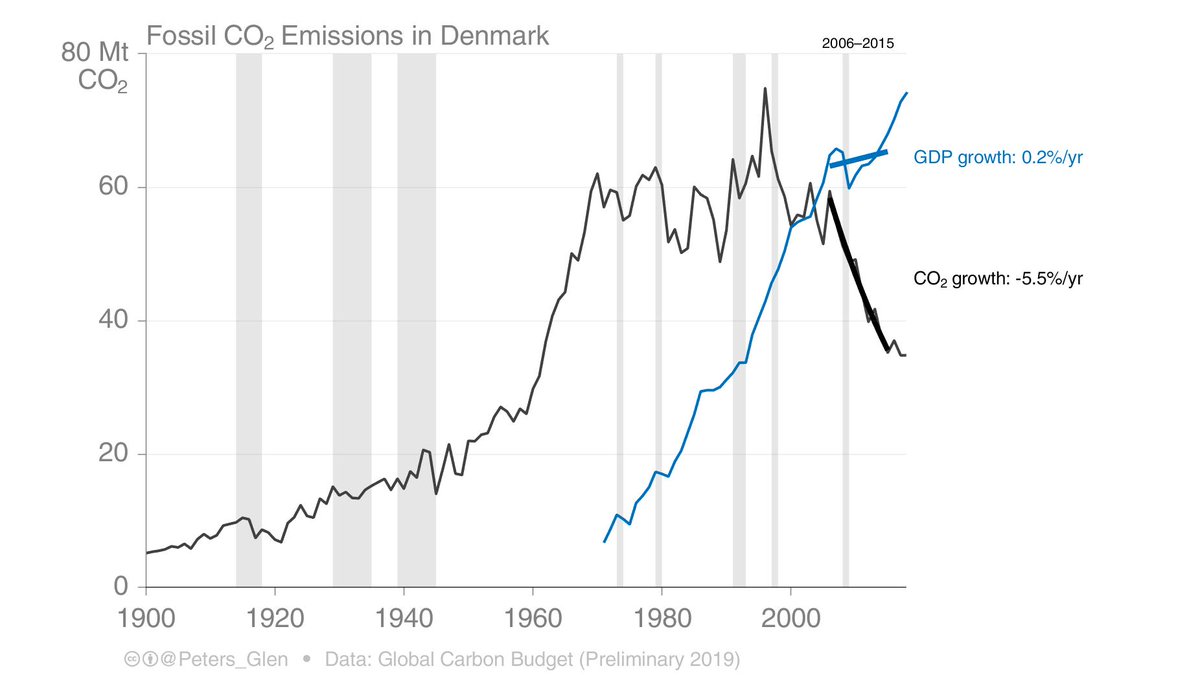
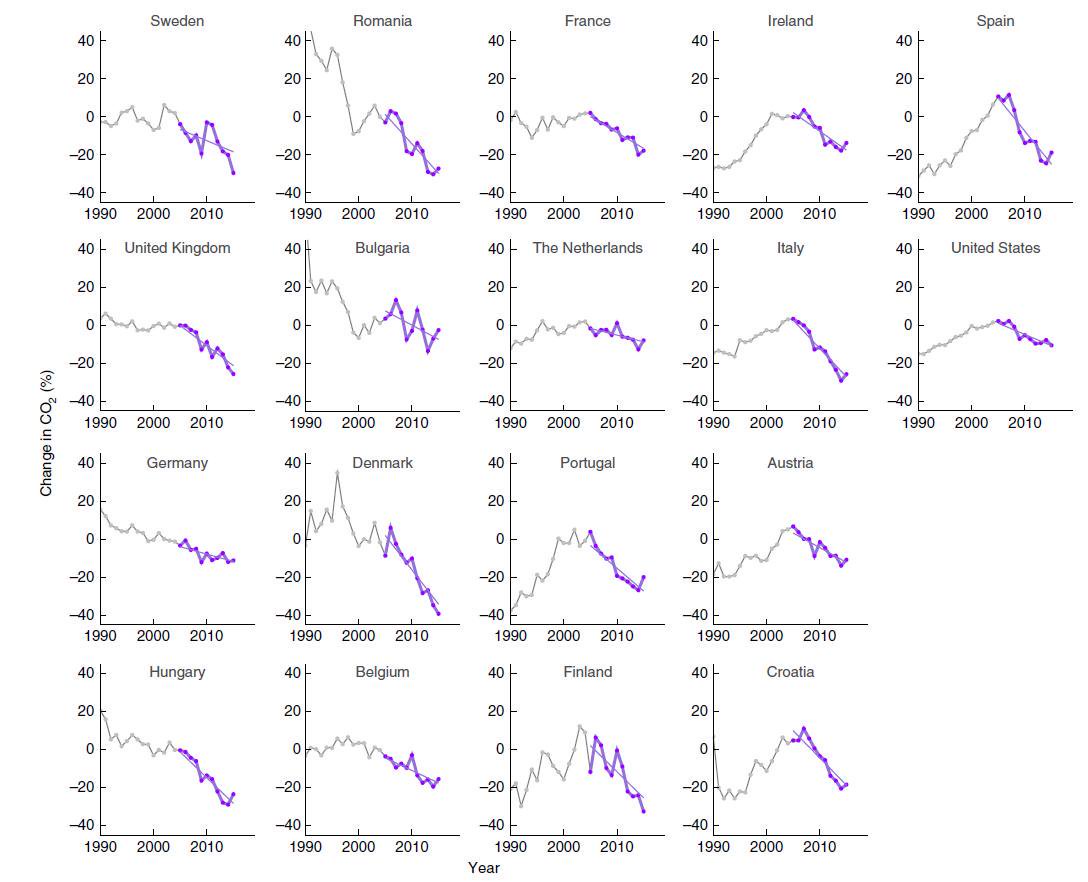
1. Denmark is the winner: Emissions declined by 5.5%/yr from 2006-2015, while GDP included slightly. There are many other years with similar declines, but GDP growth is sluggish... 
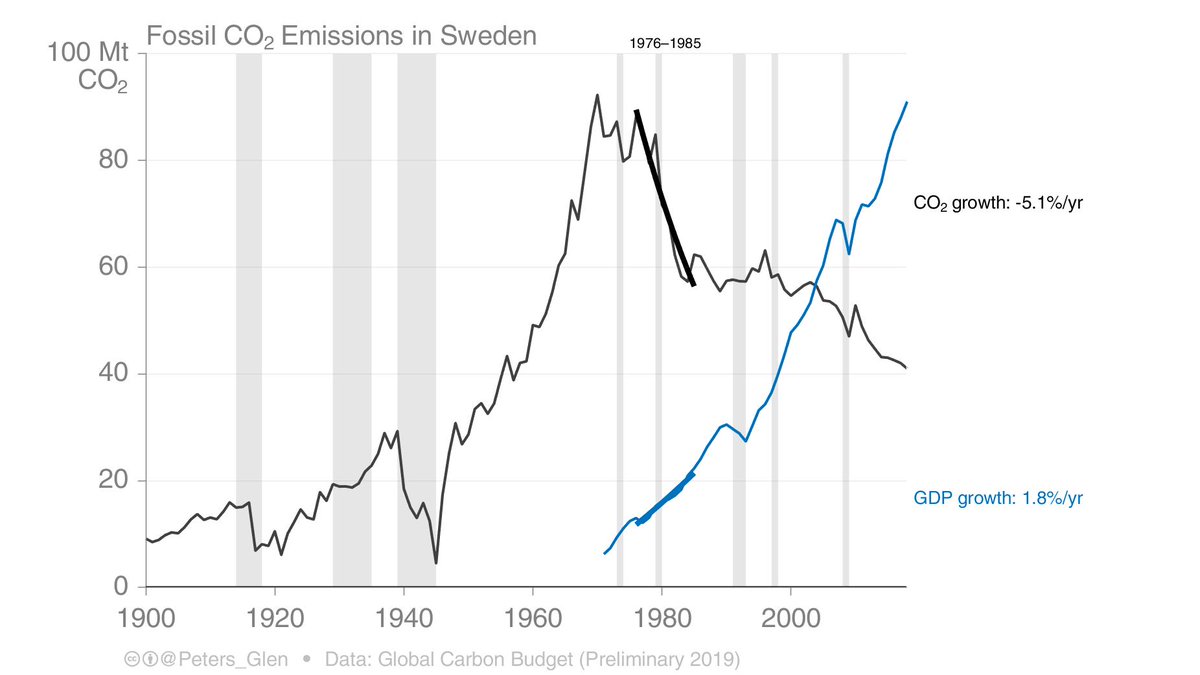
2. The Swedish nuclear boom was significant, with emission reductions of 5.1%/yr from 1976-1985, while GDP went up 1.8%/yr. Swedish emissions continue down, but at a slower rate.
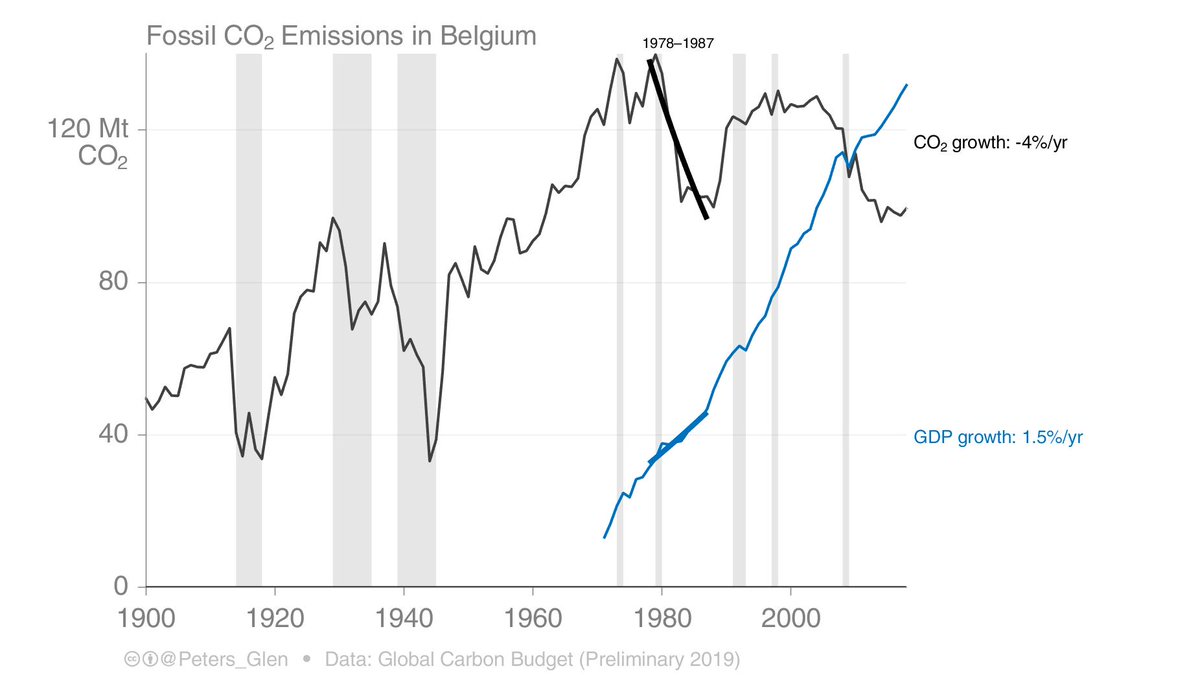
3. Belgium nuclear: emission reductions of 4.0%/yr from 1978-1987, while GDP went up 1.5%/yr.
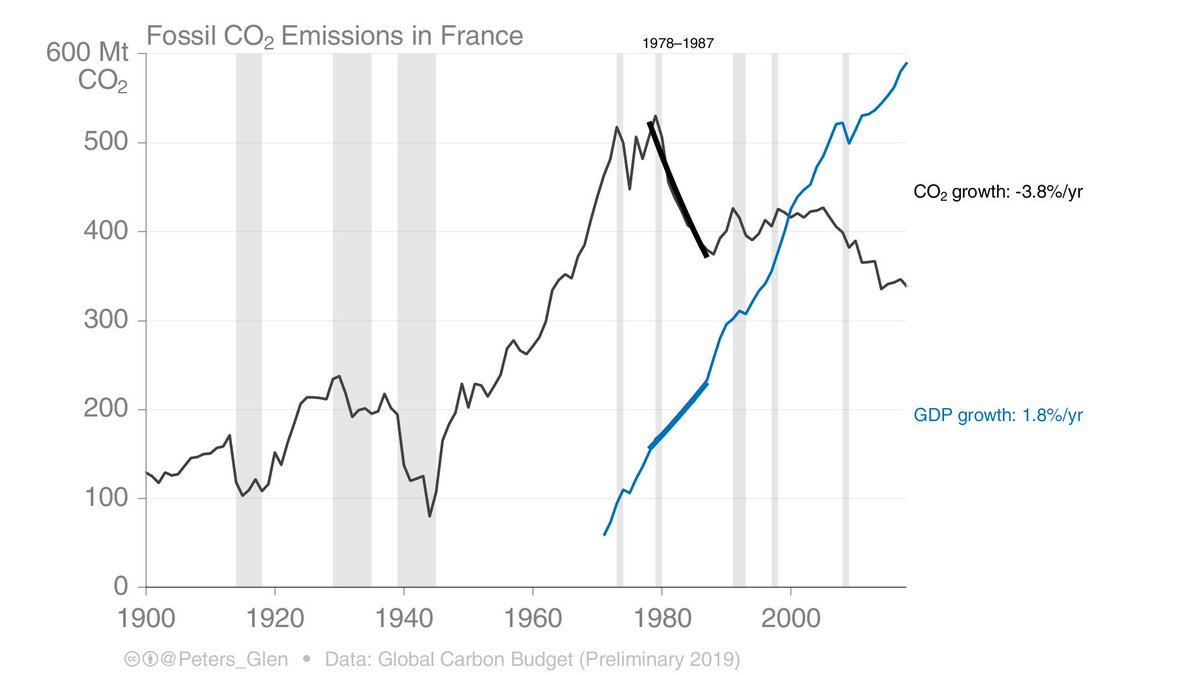
4. French nuclear: emission reductions of 3.8%/yr from 1978-1987, while GDP went up 1.8%/yr.
5. Finland: emission reductions of 3.6%/yr from 2007-2017, while GDP went up 0.1%/yr (a little shaky, but...).

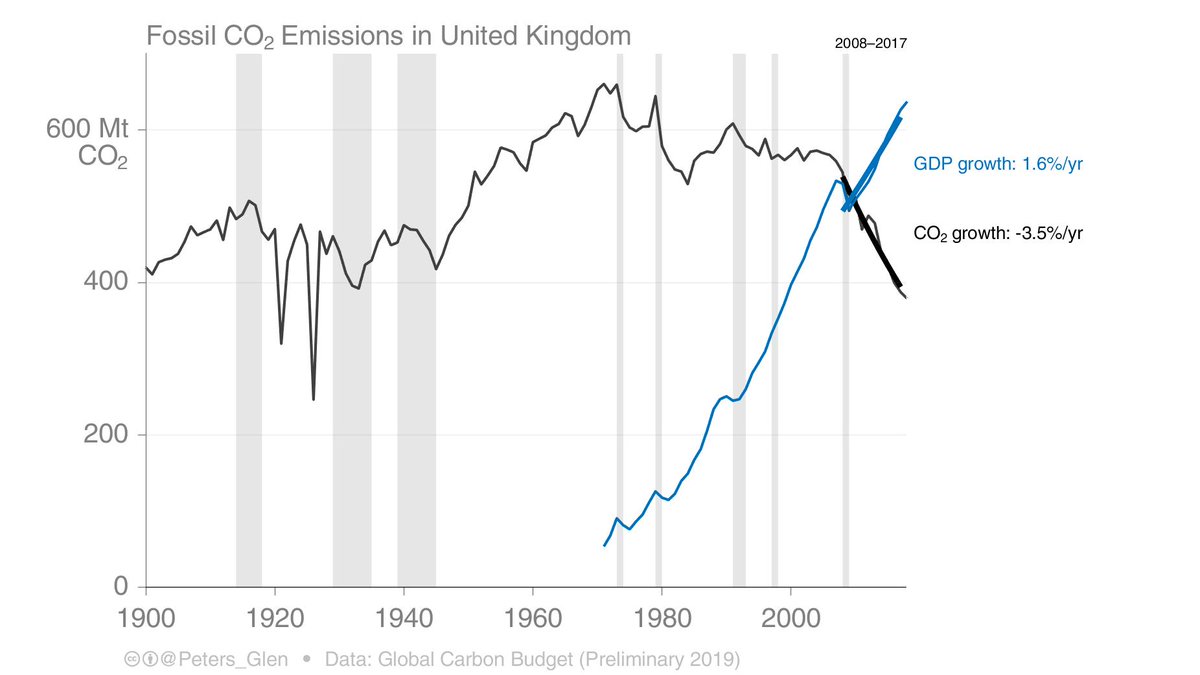
6. Great Britain and the great coal decline: emission reductions of 3.5%/yr from 2007-2017, while GDP went up 1.6%/yr.
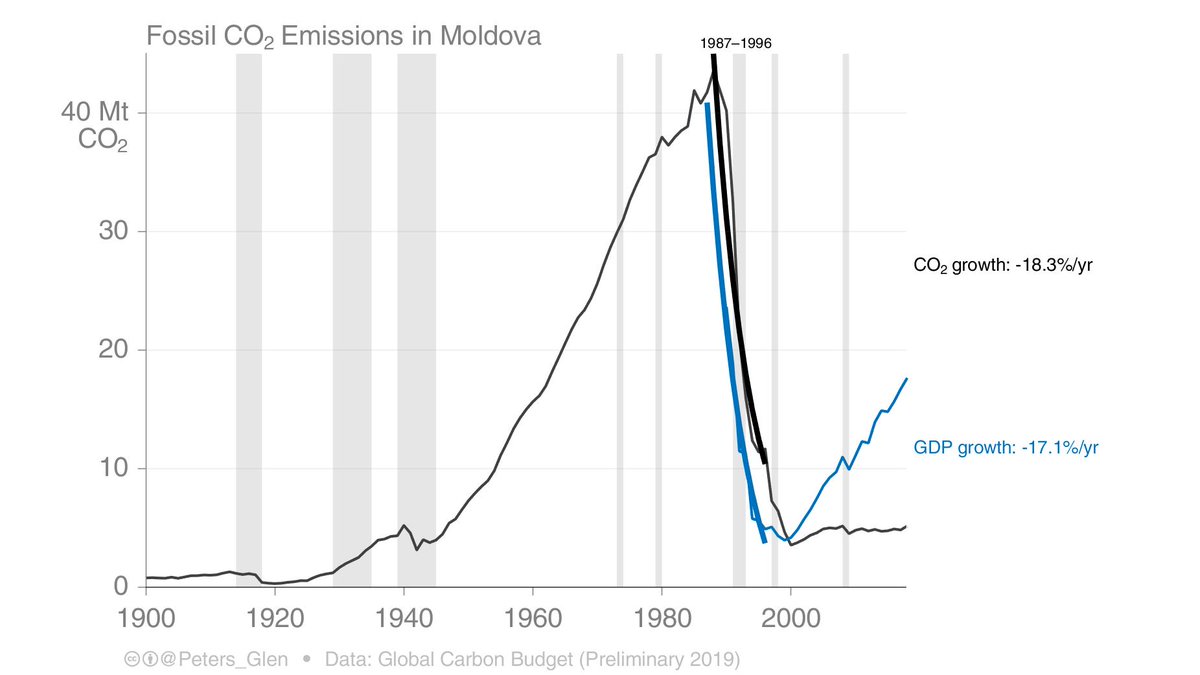
Of course, there is a whole bunch of countries where emissions went down much faster, along with GDP.
Moldova, Russia, all former Soviet countries, eastern Europe, North Korea, etc…
Is this the way we want to reduce emissions?
Moldova, Russia, all former Soviet countries, eastern Europe, North Korea, etc…
Is this the way we want to reduce emissions?
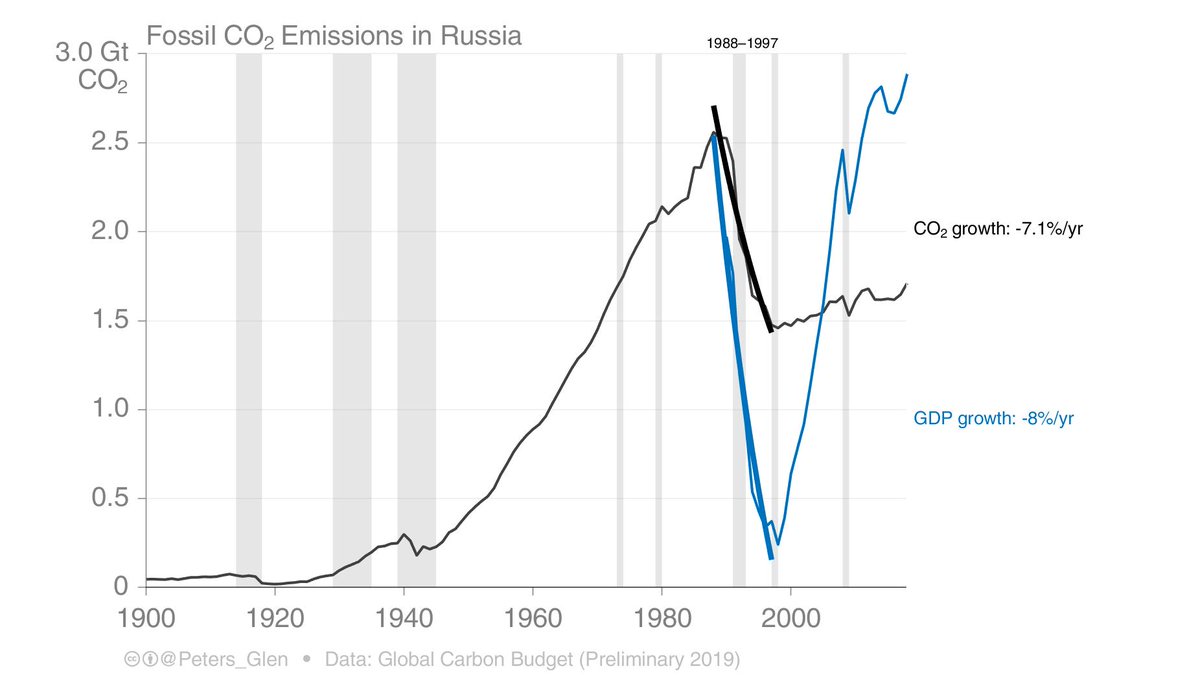
In the past, emissions have gone down because of
1. Economic collapse
2. Nuclear (has been very effective, hard to deny that)
3. Slow growth or declining energy use with rapid renewables growth (next tweet)
1. Economic collapse
2. Nuclear (has been very effective, hard to deny that)
3. Slow growth or declining energy use with rapid renewables growth (next tweet)
We recently wrote a paper on the drivers of declining emissions (sluggish energy growth so renewables displace fossils), but slow GDP growth does play a role in slow or declining energy use...
rdcu.be/bor0g
rdcu.be/bor0g
Basically, we see very few (if any) examples of cranking GDP growth combined with emission declines. Only exception is nuclear, but the focus was not really emission reductions.
We haven’t really tried deep mitigation either…
We haven’t really tried deep mitigation either…
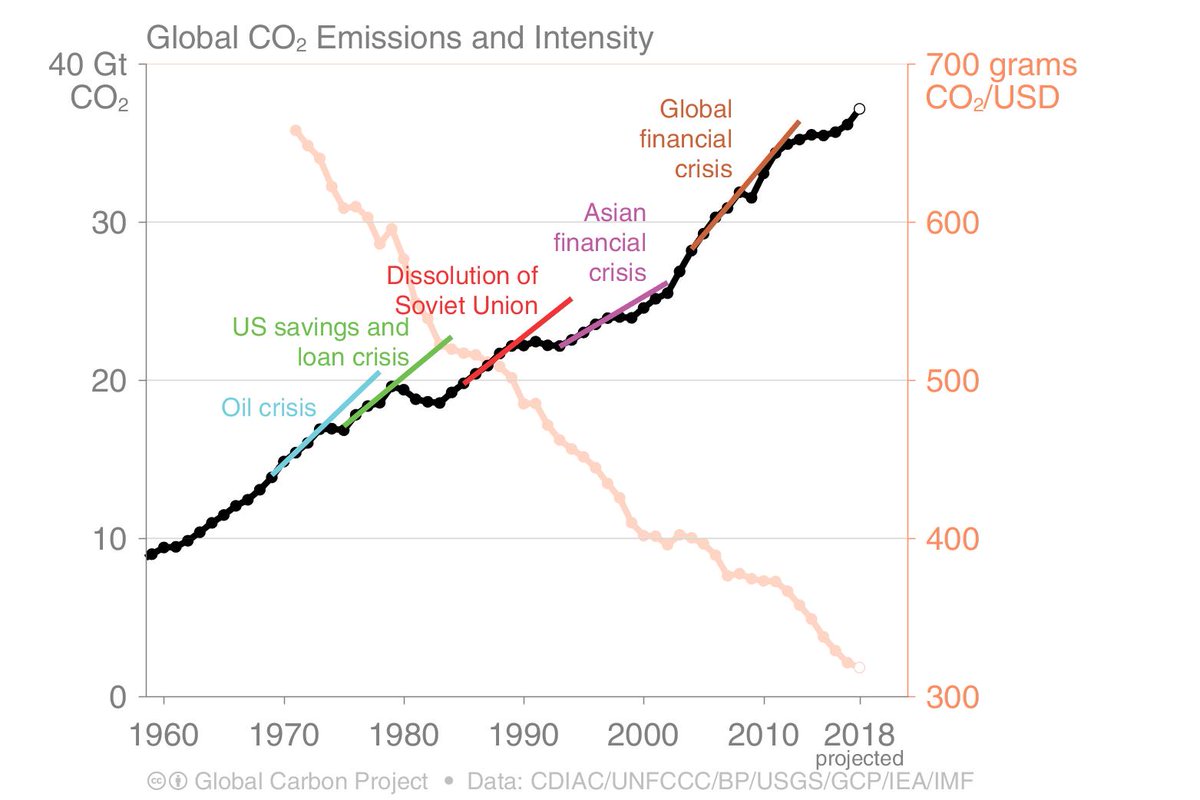
This thread was motivated by an article from 2012, on the global financial crisis. Now updated… rdcu.be/bOUaB
Now, for the fact checkers, some bonus tweets.
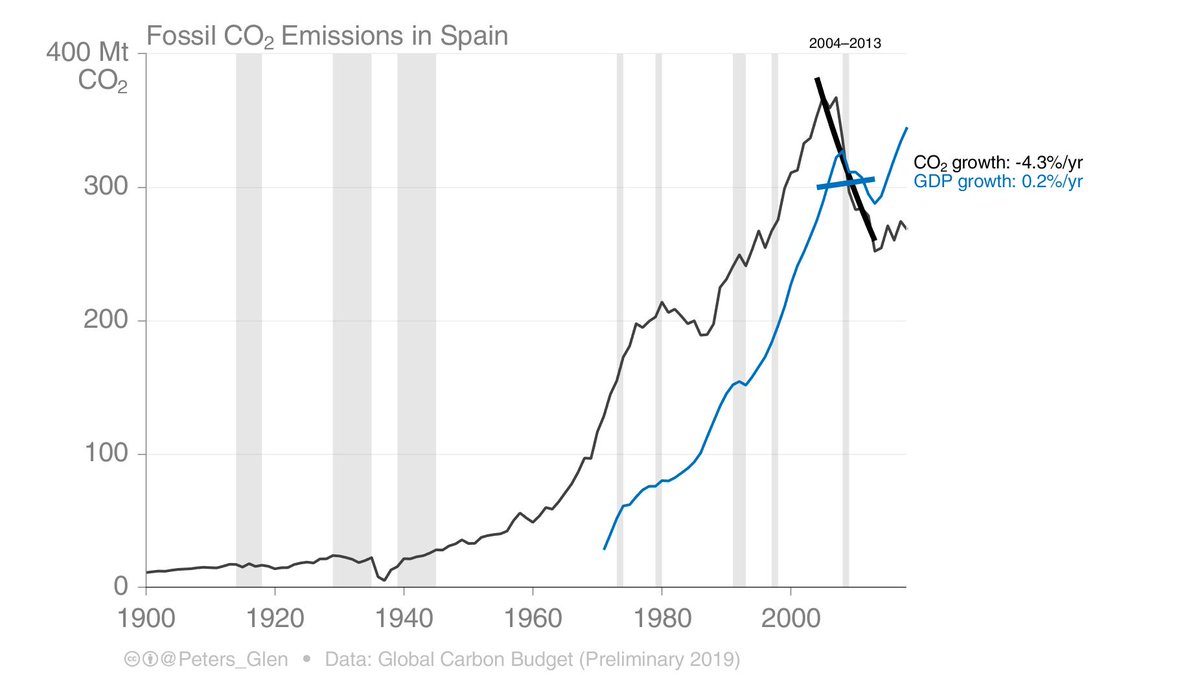
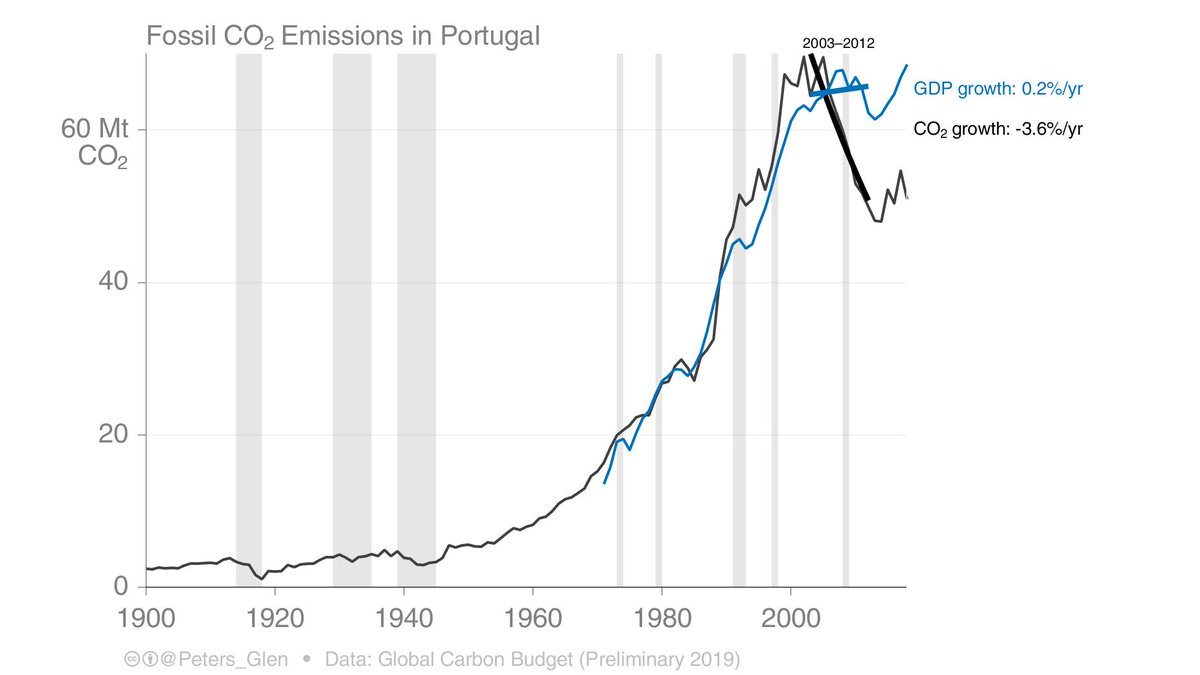
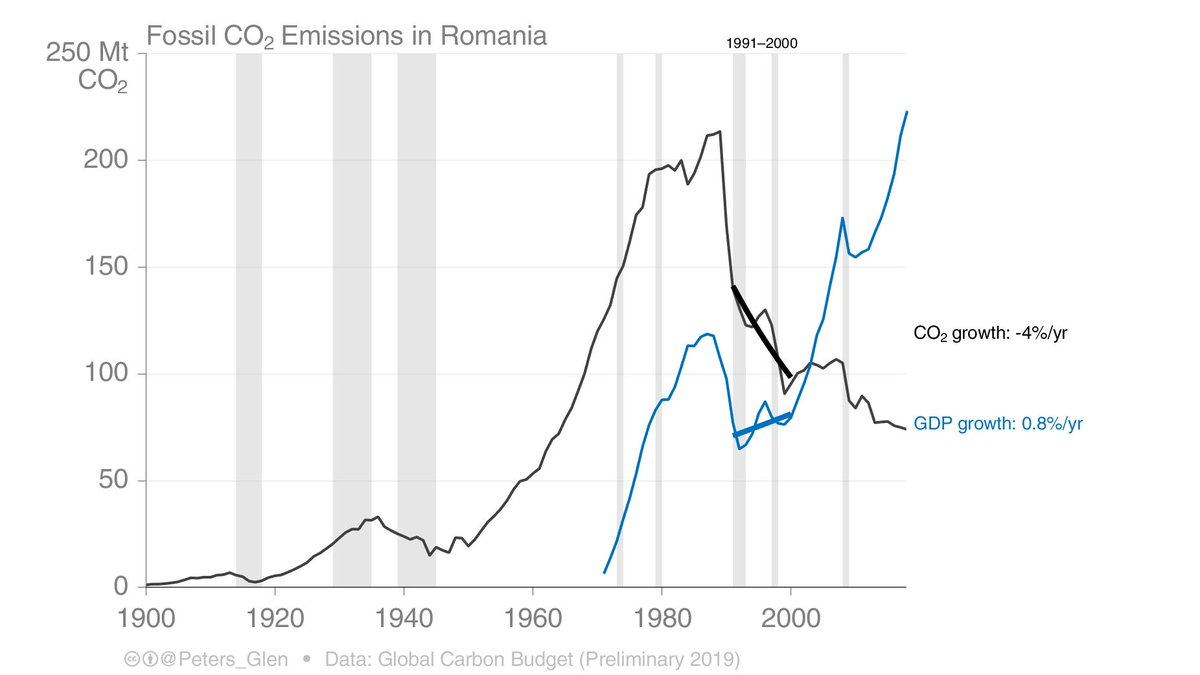
1st: I took a 10 year window, but within that time, GDP could average positive, despite economic collapse. Here are three border cases: Spain, Portugal, Romania
1st: I took a 10 year window, but within that time, GDP could average positive, despite economic collapse. Here are three border cases: Spain, Portugal, Romania
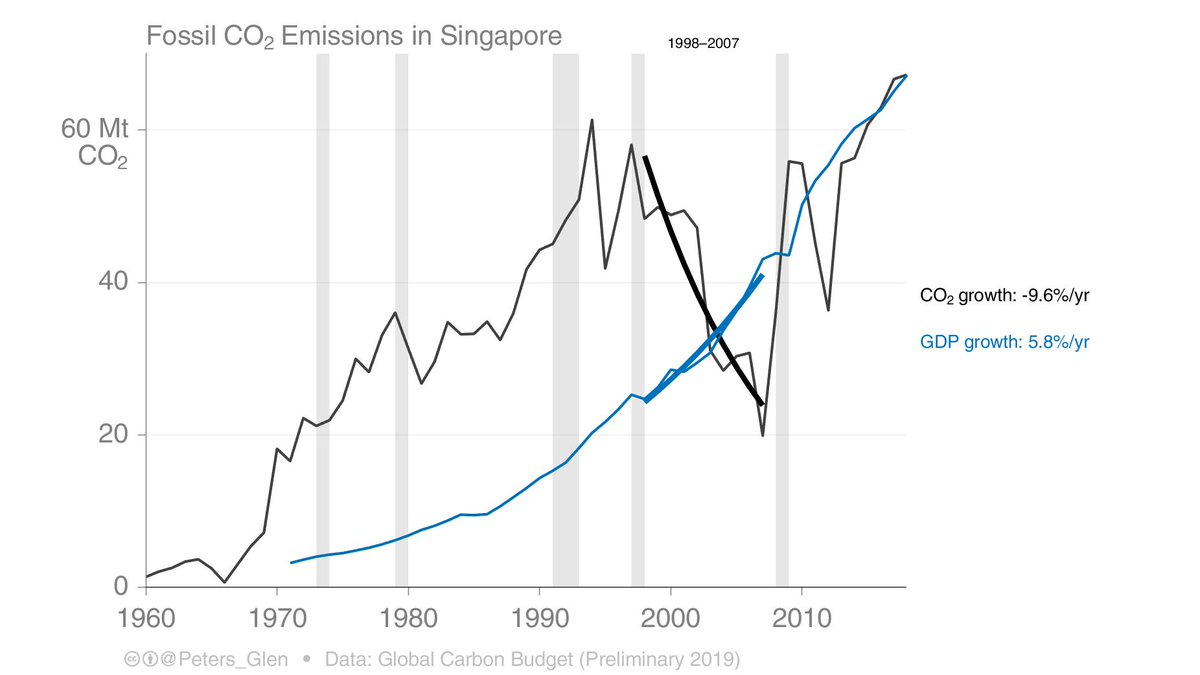
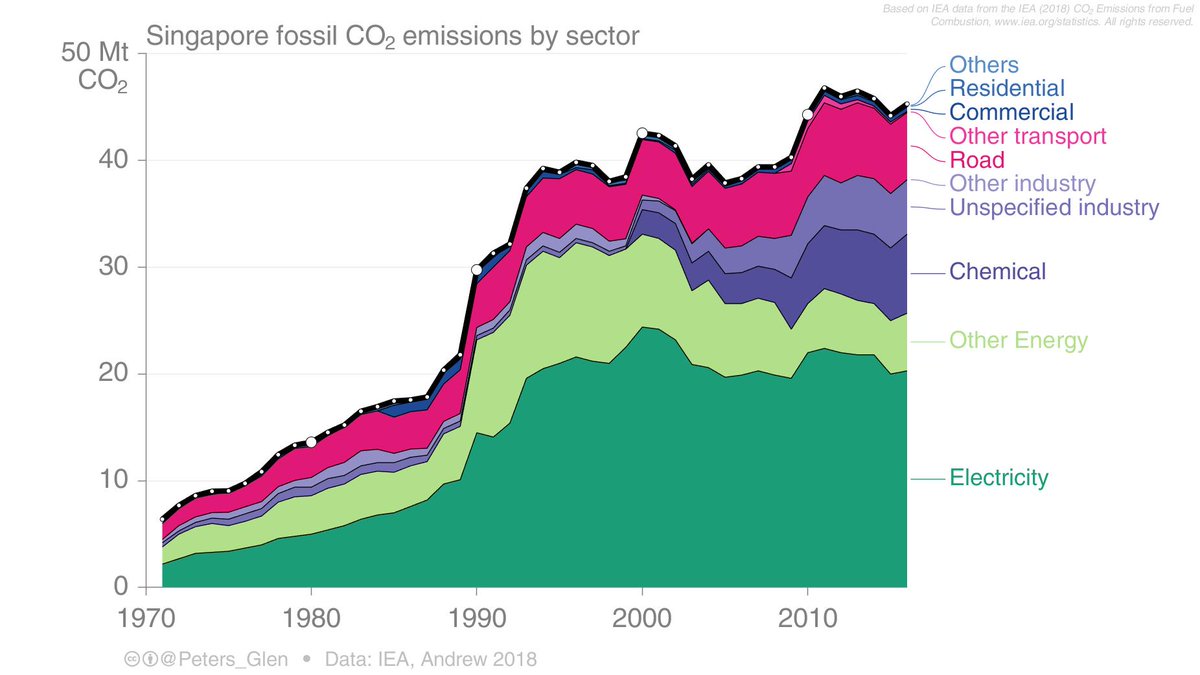
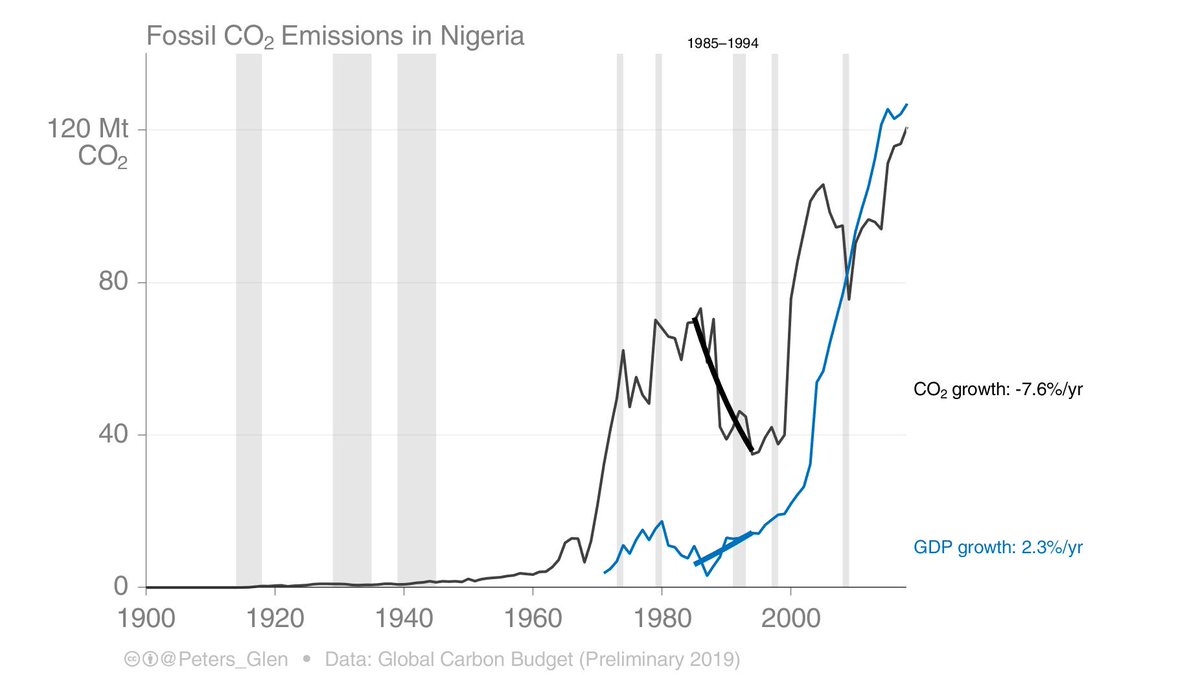
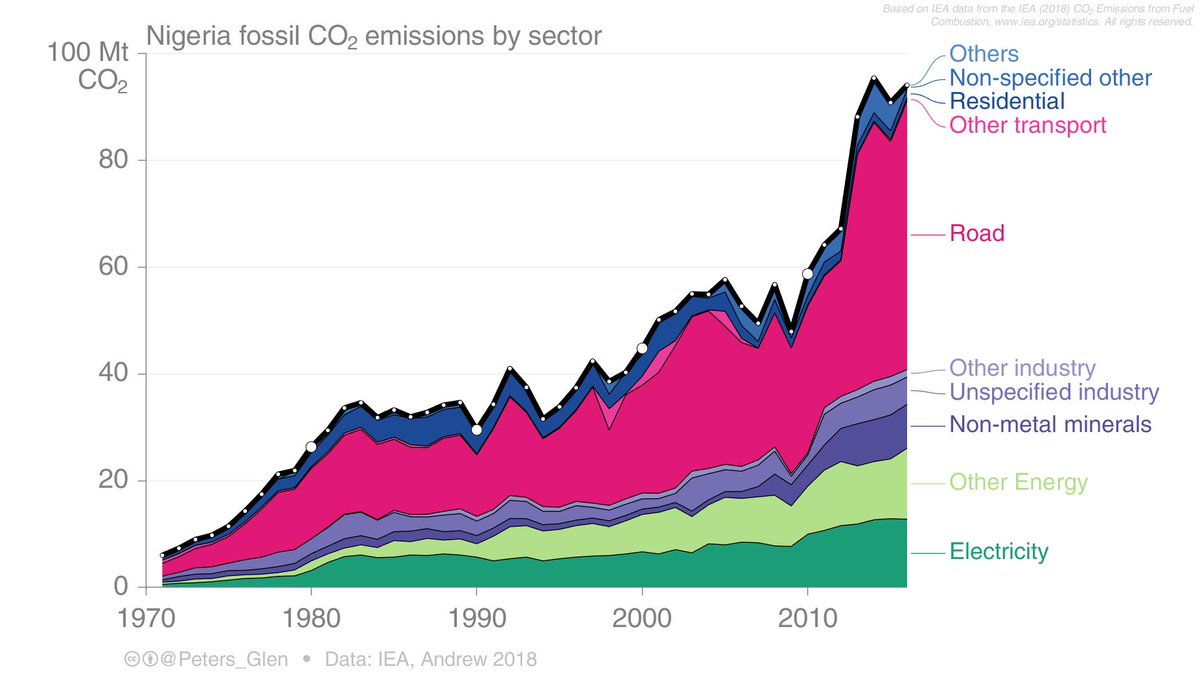
2nd: Singapore and Nigeria both show declines in the CDIAC dataset, but not IEA. This is likely because CDIAC uses a reference approach, IEA a sector approach. I trust IEA for these countries (since they have a lot of fossil fuel trade, hence problems with reference approach).
/END
But wait, don't go, there is more...
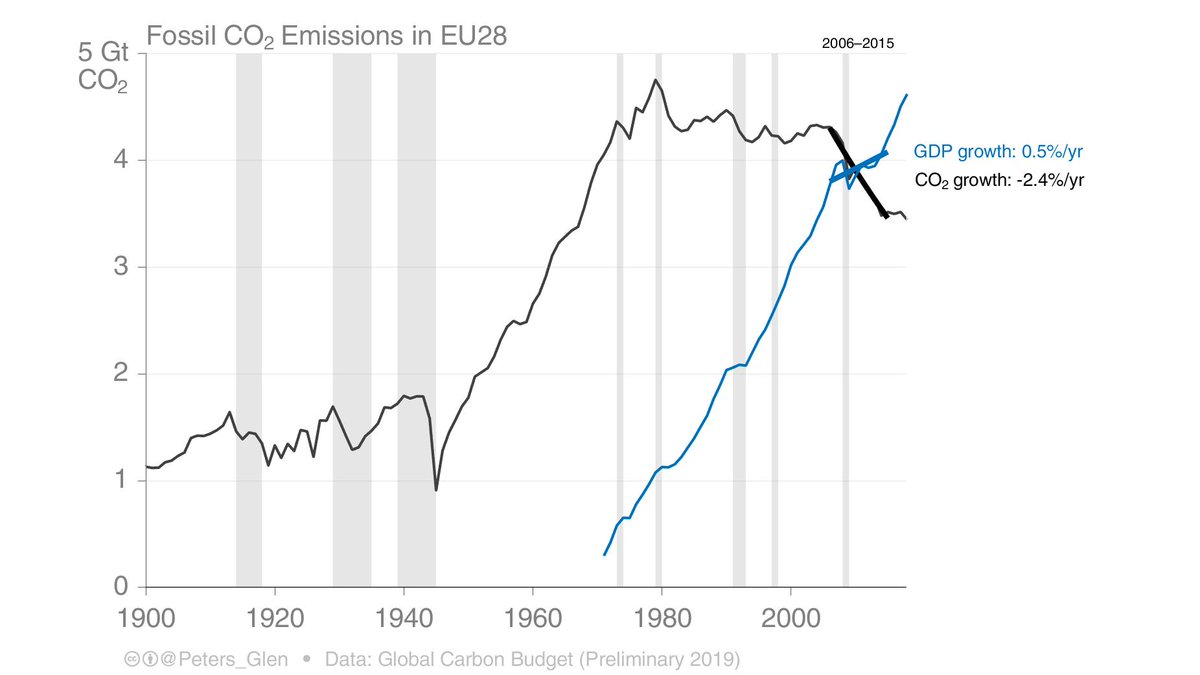
What about the EU as a whole? Emissions down 2.4%/yr from 2006-2015, including the weak GDP growth during the Global Financial Crisis (0.5%/yr). Nuclear barely noticeable.
What about the EU as a whole? Emissions down 2.4%/yr from 2006-2015, including the weak GDP growth during the Global Financial Crisis (0.5%/yr). Nuclear barely noticeable.