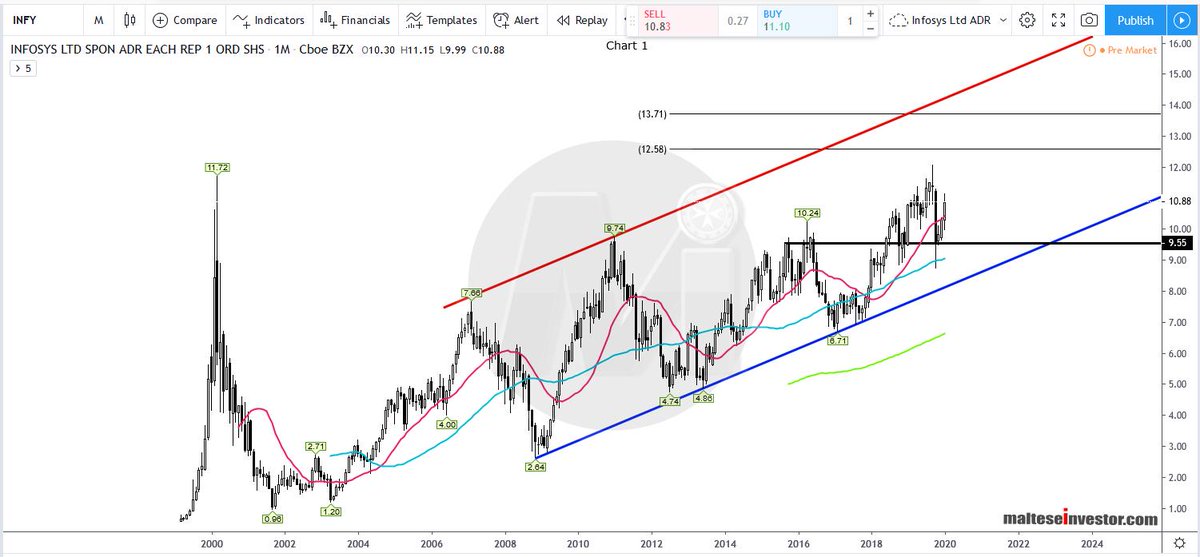
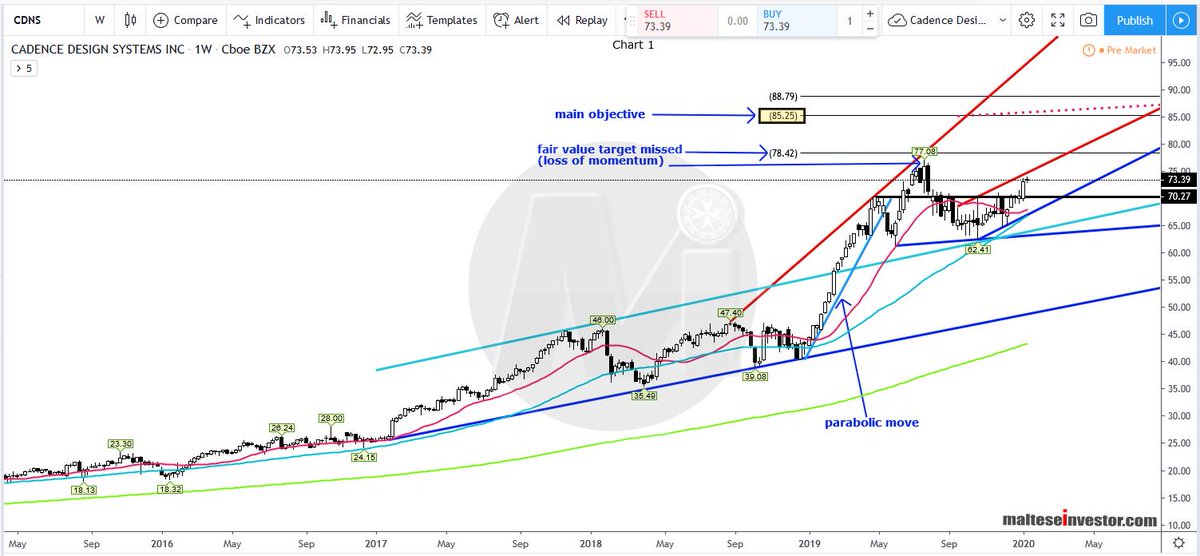
Chart 1
Data from 2007 to 2014 is messy and unreliable. The analysis begins after the 5 for 1 stock split.
2/16
Data from 2007 to 2014 is messy and unreliable. The analysis begins after the 5 for 1 stock split.
2/16
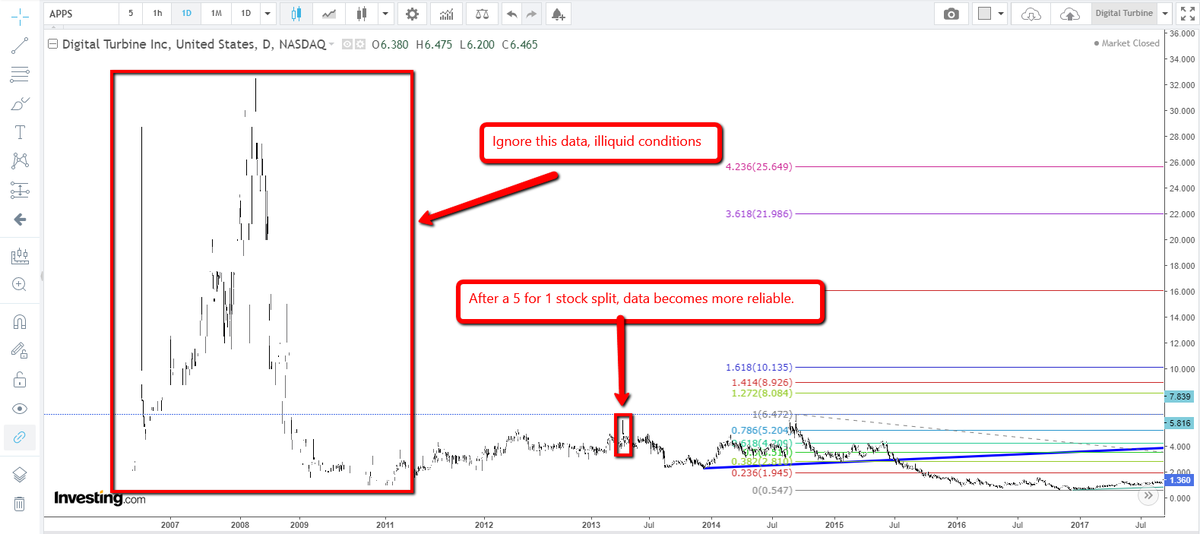
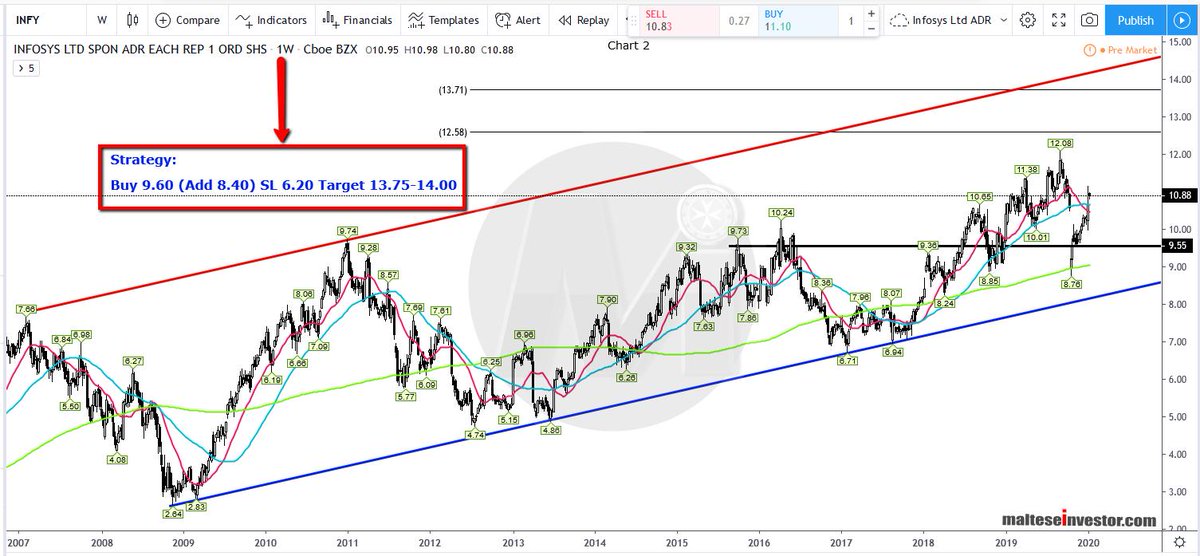
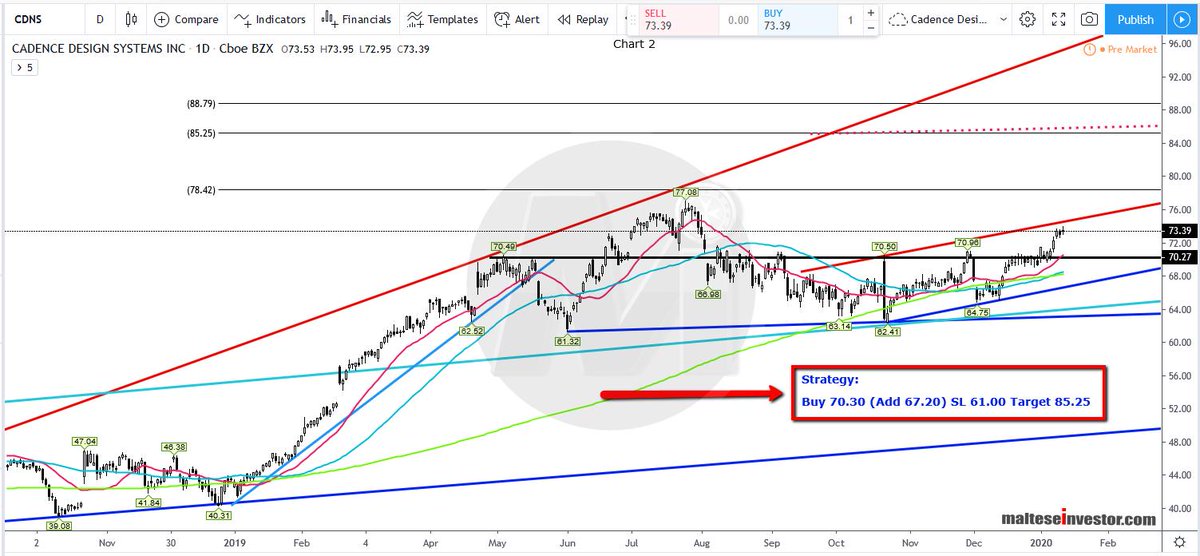
Chart 2
Sellers dominate the market, a base is formed and price rallies upwards. Inverted #Fibs are drawn catch resistance.
3/16
Sellers dominate the market, a base is formed and price rallies upwards. Inverted #Fibs are drawn catch resistance.
3/16
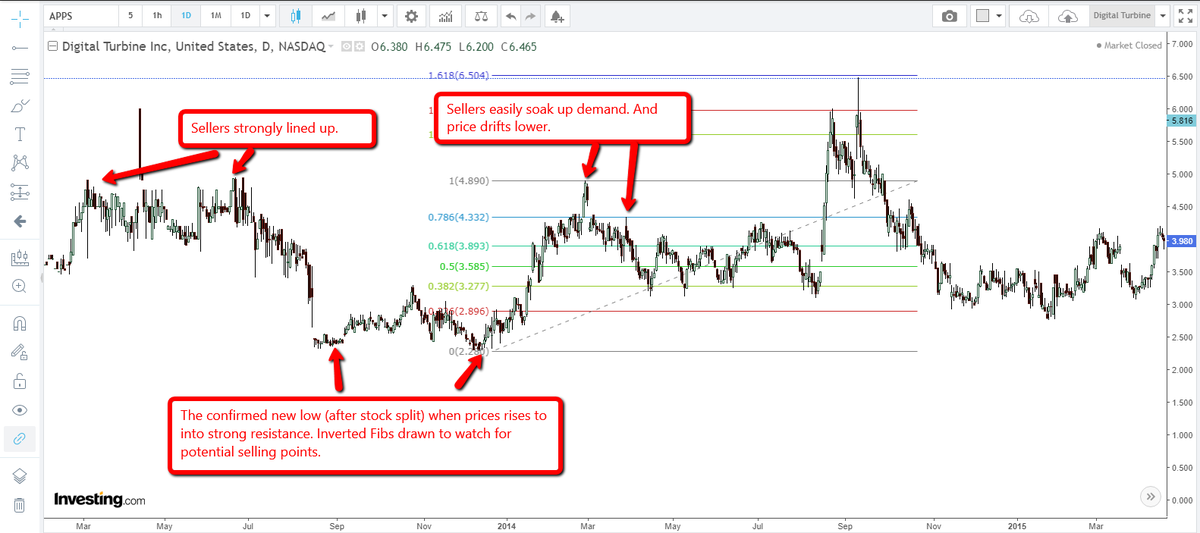
Chart 3
Buyers enter at Fib 0.618% (which is equal to the inverted Fib 0.318%) Price rallies from there, smashing above the previous high temporarily stalling at the projected Fib 1.272% and rebuffed at Fib 1.414% and then marginally failing to break above Fib 1.618%.
4/16
Buyers enter at Fib 0.618% (which is equal to the inverted Fib 0.318%) Price rallies from there, smashing above the previous high temporarily stalling at the projected Fib 1.272% and rebuffed at Fib 1.414% and then marginally failing to break above Fib 1.618%.
4/16

Chart 4
Buyers enter at purple pivot line as failed stop hunt is soaked up, another stop hunt creating a short squeeze higher. Sellers take control of pivot and new rising #trendline fails & turns into trendline pivot. Price reacts for 8 months until sellers take control.
5/16
Buyers enter at purple pivot line as failed stop hunt is soaked up, another stop hunt creating a short squeeze higher. Sellers take control of pivot and new rising #trendline fails & turns into trendline pivot. Price reacts for 8 months until sellers take control.
5/16
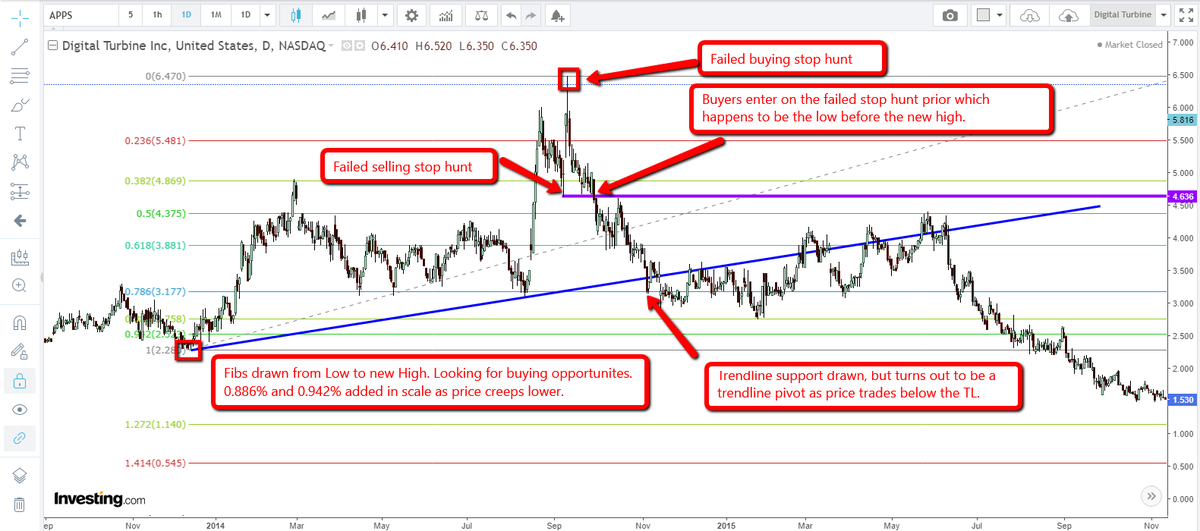
Chart 5
Part of Chart 4. Fibs 0.886% and 0.942% added.
6/16
Part of Chart 4. Fibs 0.886% and 0.942% added.
6/16

Chart 6
A new short trendline gives temporary respite to buyers, but a daily close below finally takes place.A brief tussle emerges with buyers trying to defend at the Fib 0.942% and Fib 1%. Price now moves as demand is easily soaked up.
7/16
A new short trendline gives temporary respite to buyers, but a daily close below finally takes place.A brief tussle emerges with buyers trying to defend at the Fib 0.942% and Fib 1%. Price now moves as demand is easily soaked up.
7/16

Chart 7
Prices trade lower creating new lower lows. Fib 1.272% acts as a useless support The next target is the Fib 1.414% @ $0.545.
8/16
Prices trade lower creating new lower lows. Fib 1.272% acts as a useless support The next target is the Fib 1.414% @ $0.545.
8/16

Chart 8
Part of Chart 7
9/16
Part of Chart 7
9/16

Chart 9
Buyers enter ahead of the Fib 1.414% and begin the kick start taking out supply, taking back control of the Fib 1.272%. The rising blue trendline acts as a support as price close higher on a daily basis.
10/16
Buyers enter ahead of the Fib 1.414% and begin the kick start taking out supply, taking back control of the Fib 1.272%. The rising blue trendline acts as a support as price close higher on a daily basis.
10/16

Chart 10
New Fibs are drawn from the last swing high to the new all time low. The once formidable natural pivot (purple) yields - a gap has formed and prices base off the pivot breaking through the previous swing high at $6.47.
11/16
New Fibs are drawn from the last swing high to the new all time low. The once formidable natural pivot (purple) yields - a gap has formed and prices base off the pivot breaking through the previous swing high at $6.47.
11/16

Chart 11
Discussed in chart 10. A closer look.
12/16
Discussed in chart 10. A closer look.
12/16

Chart 12
Momentum has stalled, for the moment prices cannot close above the Fib 1.272% on a daily basis. A falling line has been drawn - we are unsure if it's a trendline or trendline pivot. Two red horizontal lines have been drawn and a magenta vertical line.
13/16
Momentum has stalled, for the moment prices cannot close above the Fib 1.272% on a daily basis. A falling line has been drawn - we are unsure if it's a trendline or trendline pivot. Two red horizontal lines have been drawn and a magenta vertical line.
13/16

Chart 13
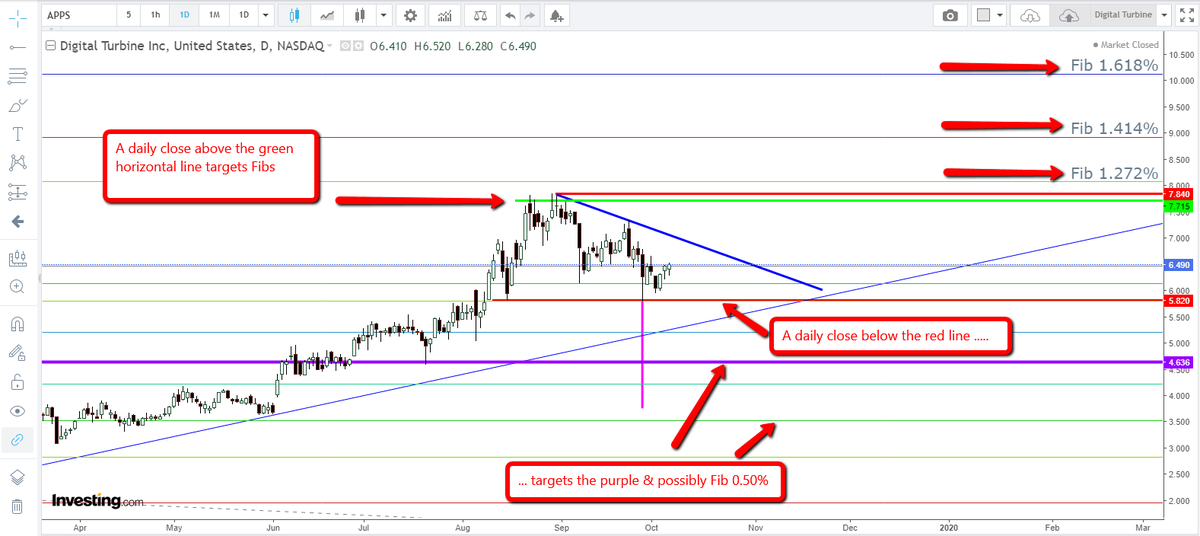
The magenta vertical line is equal to the space between the 2 red horizontal lines. A daily close below the bottom red horizontal line will target stale buyers (adding to positions) ....
14/16
The magenta vertical line is equal to the space between the 2 red horizontal lines. A daily close below the bottom red horizontal line will target stale buyers (adding to positions) ....
14/16
..... and new buyers on the purple pivot line. A further daily close below the pivot targets the bottom of the magenta line which is equal to the still open gap.
15/16
15/16

Chart 14
Support at the Fib 0.50% could attract. A new green horizontal line has been added, a daily close above could see the Fibs 1.272%, 1.414% and 1.618% come into play. But a false breakout is also a possibility.
16/16
Support at the Fib 0.50% could attract. A new green horizontal line has been added, a daily close above could see the Fibs 1.272%, 1.414% and 1.618% come into play. But a false breakout is also a possibility.
16/16