Here is my thread, attempting to explain some aspects of the new paper by former students Sumithra Sankaran, Sabiha Majumder and Ashwin – published in Methods in Ecology and Evolution.
It looks really pretty in the formal formatted version :) 1/n
It looks really pretty in the formal formatted version :) 1/n

Before I go further, we are so happy that there is Kannada Abstract to this paper! I will do a Kannada thread as well later.
Thanks to Kolleagala Sharma @kollegala for the help with Kannada abstract. Incidentally, the paper came out on Nov 1st! 2/n
Thanks to Kolleagala Sharma @kollegala for the help with Kannada abstract. Incidentally, the paper came out on Nov 1st! 2/n

@kollegala Some background: Many ecosystems can ‘suddenly’ switch states, also called regime shifts or tipping points. This can happen in semi-arid vegetation, mussel beds, lakes, corals, etc. Therefore, we want to know which ecosystems are prone to sudden tipping. 3/n
@kollegala An ideal way to find this is to perturb the ecosystem & measure how it returns. But this is difficult & in many cases, such a perturbation may cause the tipping! So this is not even desirable. 4/n
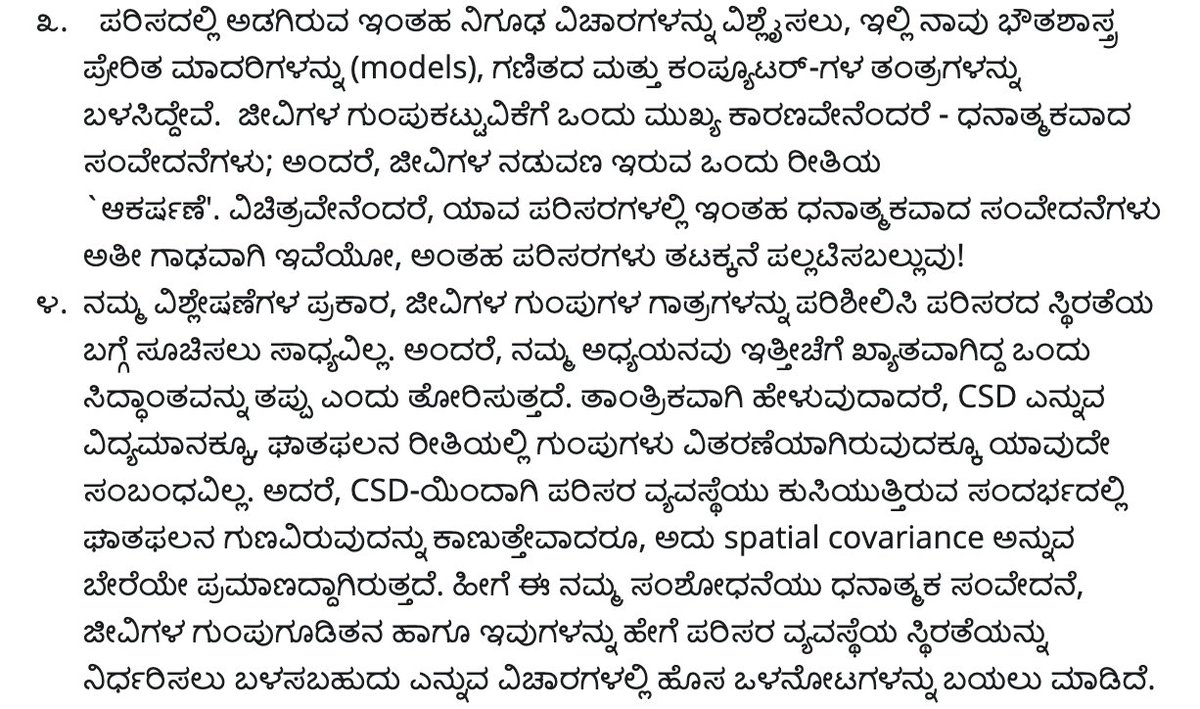
@kollegala A paper in Nature 2007 proposed that we may infer stability by measuring properties of spatial patterns. Specifically, they focused on semi-arid vegetation. Here is an image from Google Earth, in Rajasthan. Note that not all clusters of plants are of same size. 5/n
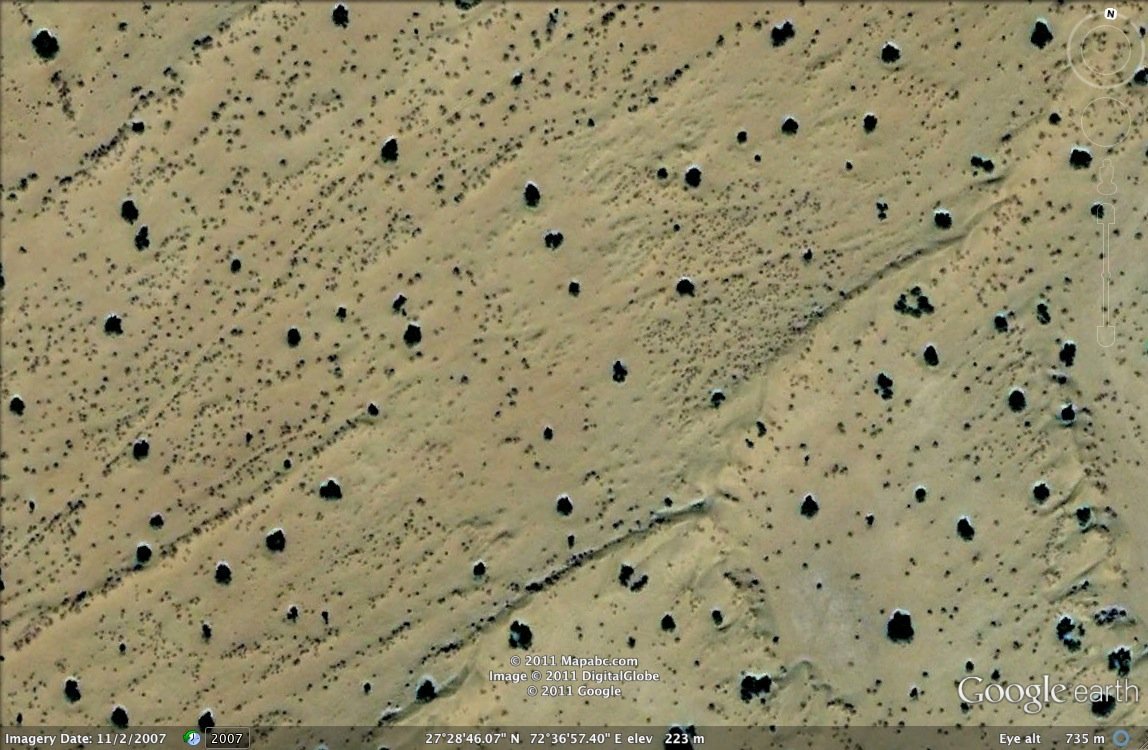
@kollegala Basically, they argued that the resilient (or stable) ecosystems do not have any ‘typical size’ of clusters. Broadly, they claimed that cluster-size distribution and its properties can inform us about ecosystem resilience. 6/n
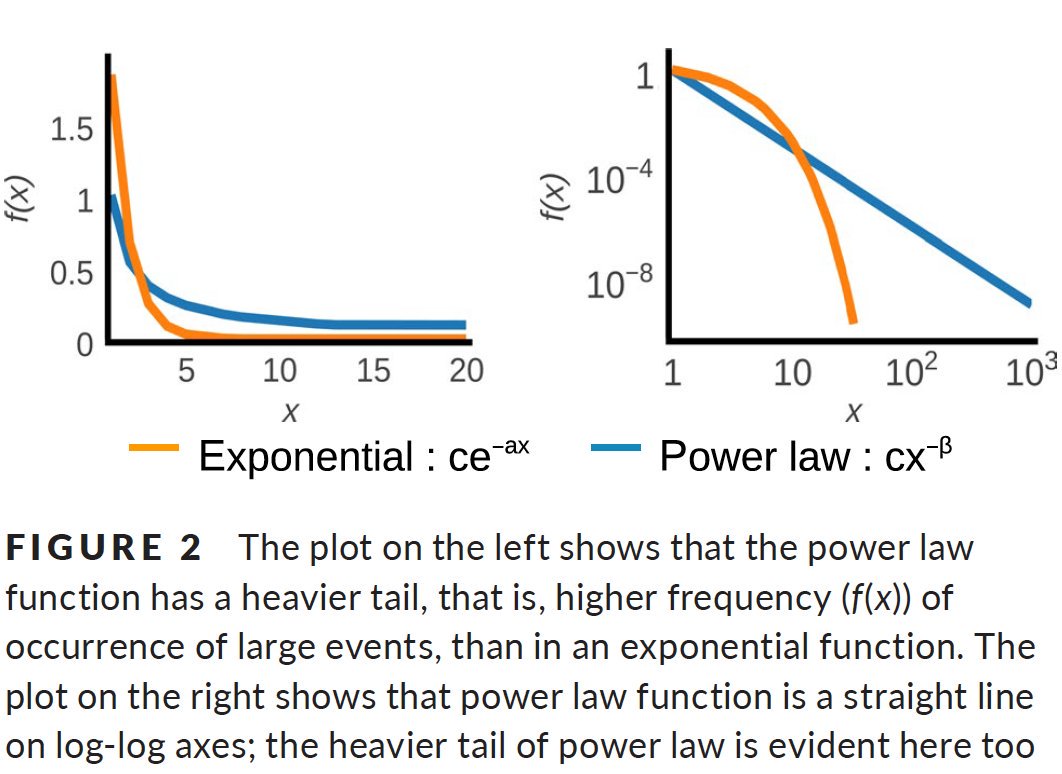
@kollegala Mathematically, this means that the frequency distribution of cluster sizes is a power-law. Power-laws are fascinating because their mean & variance are infinitely large!
This is in quite a contrast to distributions we regularly use – like Gaussian/normal or exponential. 7/n
This is in quite a contrast to distributions we regularly use – like Gaussian/normal or exponential. 7/n
@kollegala To make this clear, we show a graph in the paper tries to explain how power-laws are fundamentally different from normal or exponential decay functions.
Power-laws have a large tail, and hence you are likely to find very large-sized patches in such systems. 8/n
Power-laws have a large tail, and hence you are likely to find very large-sized patches in such systems. 8/n
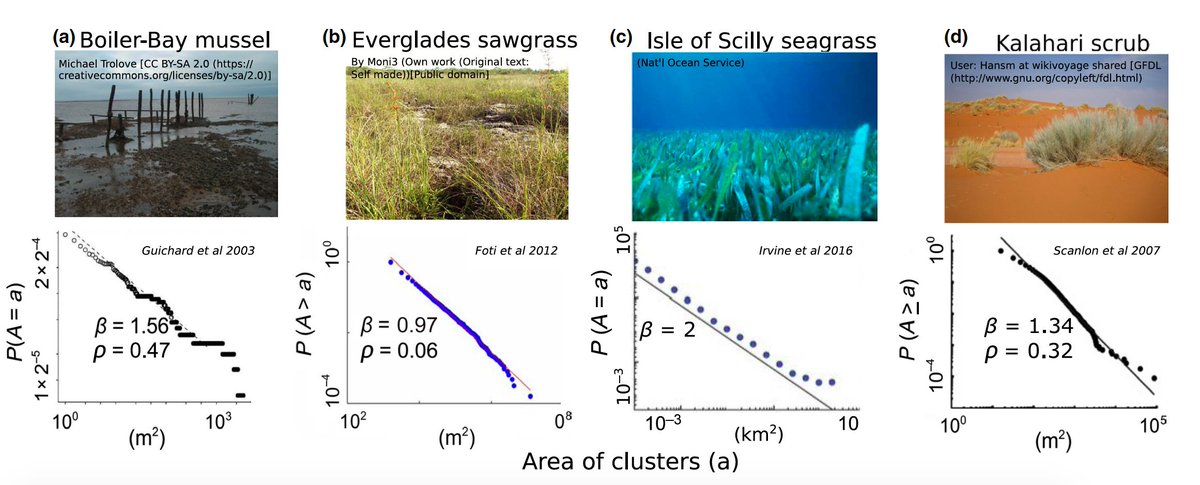
@kollegala These are not just mathematical fantasies! Many empirical systems do show power-law distribution of clusters.
Here is Figure 1 from our paper with empirical examples of power-law clustering. 9/n
Here is Figure 1 from our paper with empirical examples of power-law clustering. 9/n
@kollegala Does it mean they are highly stable ecosystems? There were several follow up studies, that found mixed evidence to this overall claim.
That’s the background to Sumithra’s work. 10/n
That’s the background to Sumithra’s work. 10/n
@kollegala The main result from Sumithra’s work is that the above-proposed link between resilience and cluster-size distribution is NOT robust. So it’s a NEGATIVE result!
To show this, she used a simple computational model of ecosystems 11/n
To show this, she used a simple computational model of ecosystems 11/n
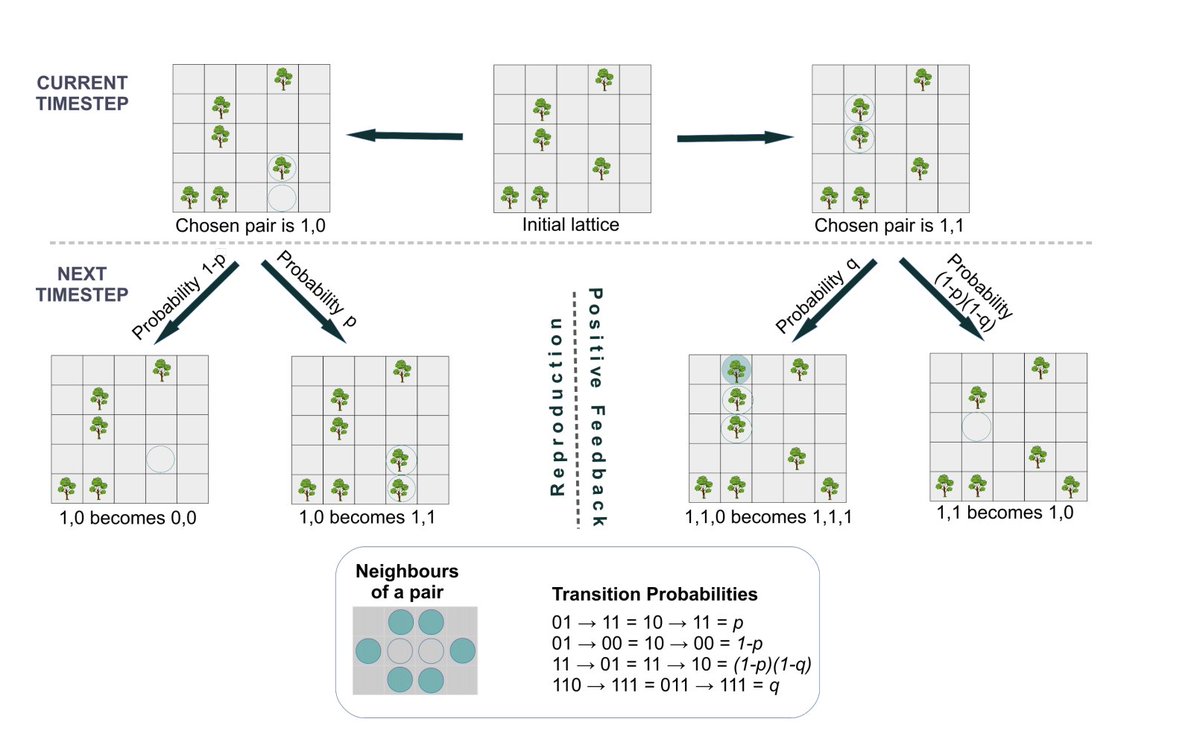
@kollegala Here is a pictorial representation of the spatial-model.
The model itself is directly taken from a statistical physics paper (Lubeck, J Stat Phys 2006) but with ecological interpretation thrown in! 12/n
The model itself is directly taken from a statistical physics paper (Lubeck, J Stat Phys 2006) but with ecological interpretation thrown in! 12/n
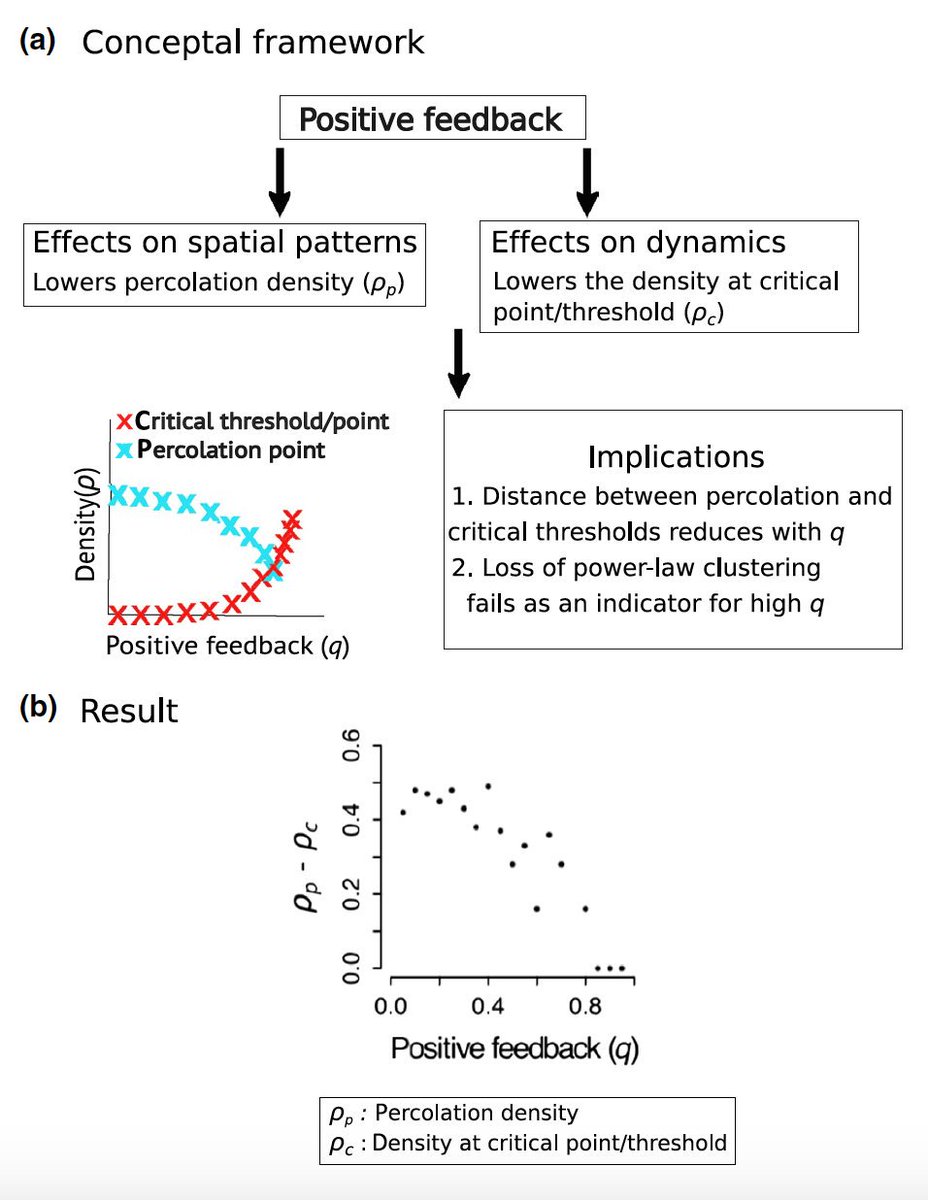
@kollegala Sumithra showed that power-law cluster-size distribution can occur even when systems are very close to tipping points. Hence, power-laws are not indicators of ecosystem resilience. Here is a conceptual diagram and result that explains the results. 13/n
@kollegala Power-law cluster-sizes are also studied extensively in the context of ‘percolation’ in the physics literature. We showed that power-law cluster-size distribution in our ecology models relates to percolation of physical systems! 14/n
@kollegala We also talk about what else can be measured to infer resilience. There are more technical aspects! Because this paper uses ideas from many areas – ecology, physics, math, computer simulations and statistics of fitting distributions – we explain many technical aspects. 15/n
@kollegala Finally, I must say that handling Editor Dr Hao Ye at Methods in Ecology and Evolution gave extensive comments that really helped the clarity and presentation of the manuscript. 16/16.
@kollegala If you came this far, press the like button (for me know how many really read this!) and Thanks a lot! ..END!!