
1/ I want to do a thread on the fly — remaining objective as possible — as I analyze some of the positive & negative indicators during the latest short squeeze.
As we all probably know already, the global equity market index has broken out & trades at a 52-week high. $VT $ACWi
As we all probably know already, the global equity market index has broken out & trades at a 52-week high. $VT $ACWi

2/ During the initial phases of the bottoming process breakout, the US stock market was lagging due to $USD weakness. However, as the greenback rallied back, the rest of the world's stocks have started to lag the US index once more. $SPY $SPX

3/ During uptrends investors want to see higher beta, cyclical, strong growth sectors outperforming.
The fact that $QQQ broke out of a triangle versus $SPY on a relative basis is a positive, in my opinion.
US Tech continues to lead.
The fact that $QQQ broke out of a triangle versus $SPY on a relative basis is a positive, in my opinion.
US Tech continues to lead.

4/ The stock market breakout occurred just as the blow-off top in government bond rally was peaking out (August to October).
This is also when the recession calls got the loudest. However, for the intermediate Treasuries, that uptrend has been broken. $IEF
This is also when the recession calls got the loudest. However, for the intermediate Treasuries, that uptrend has been broken. $IEF

5/ That is also true for the US corporate bond market, which went through a rocket-like rally since the Fed's monetary policy pivot shift. $LQD
I would assume we are in for a period of correcting & most likely a long consolidation to digest the recent gains.
I would assume we are in for a period of correcting & most likely a long consolidation to digest the recent gains.

6/ The Treasury Long Bond, which the majority of the bond traders focus on, has corrected meaningfully with a -9% drawdown since the late-August peak. $TLT
Technically, we seem to be in a mean reversion right now. The first downside target (trendline) was touched recently.
Technically, we seem to be in a mean reversion right now. The first downside target (trendline) was touched recently.

7/ Second target, in my opinion, will be the 12-month moving average which is even lower for the $TLT.
Even though Treasuries might rebound, eventually they could break the trend support resulting in a stock/bond ratio edging higher.
The recent breakout looks encouraging! $SPY
Even though Treasuries might rebound, eventually they could break the trend support resulting in a stock/bond ratio edging higher.
The recent breakout looks encouraging! $SPY

8/ All of the major regions of the world recently posted higher highs — which tends to define an uptrend.
The US is at record highs, Europe is at 18-month highs and Asian equities hit resistance from April of this year. $SPY $VGK $AAXJ
The US is at record highs, Europe is at 18-month highs and Asian equities hit resistance from April of this year. $SPY $VGK $AAXJ

9/ However, it is not all rainbows & lollypops out there.
First of all the riskest form of public credit — the junk bond market, especially CCC rated — is not confirming this rally right now. $HYG $JNK
Junk bond ETF has stalled recently...
First of all the riskest form of public credit — the junk bond market, especially CCC rated — is not confirming this rally right now. $HYG $JNK
Junk bond ETF has stalled recently...

10/ This is also apparent in the credit spreads, where junk spread over similar-maturity Treasury bonds are not falling below 375 basis point support.
The bulls want to see spreads narrow further, while bears want another move back towards 450 basis point range. $HYG $JNK
The bulls want to see spreads narrow further, while bears want another move back towards 450 basis point range. $HYG $JNK

11/ I don't like to cherry-pick data, like so many perma bulls & bears, so to be fair investment-grade spreads are doing exactly what the bulls want to see. $LQD
A further move below 110 basis point range should support equities over fixed income in the coming months.
A further move below 110 basis point range should support equities over fixed income in the coming months.

12/ Junk bond credit spreads in developed & emerging market economies still have a lot of work to do in my opinion. This isn't an overly bullish picture right now:
• United States
• Eurozone
• Emerging Asia
• Emerging Markets
• United States
• Eurozone
• Emerging Asia
• Emerging Markets


13/ Just a side note for the fixed income bulls. Pay attention here!
The USD denominated EM debt is also breaking down in similar fashion to US Treasuries & US corporate bond markets. $EMB
The USD denominated EM debt is also breaking down in similar fashion to US Treasuries & US corporate bond markets. $EMB

14/ The weakness in bond prices (rise in interest rates) has naturally brought about some weakness in the equity market — especially the rate-sensitive proxies like REITs. $VNQ

15/ However, under the hood, the stock market breakout is not that convincing right now.
This isn't necessarily bearish, but the participation of stocks is not acting too bullish.
There is also a bearish divergence we have to deal with, too!
This isn't necessarily bearish, but the participation of stocks is not acting too bullish.
There is also a bearish divergence we have to deal with, too!

16/ I'm gonna jump into a few charts by @MacroCharts. Before I start, let me just say — if you aren't already — follow him. Immediately! 😂
It's nice to see an expanding number of global indices that are entering an uptrend (have a rising 200 day MA). $VT $ACWI
It's nice to see an expanding number of global indices that are entering an uptrend (have a rising 200 day MA). $VT $ACWI
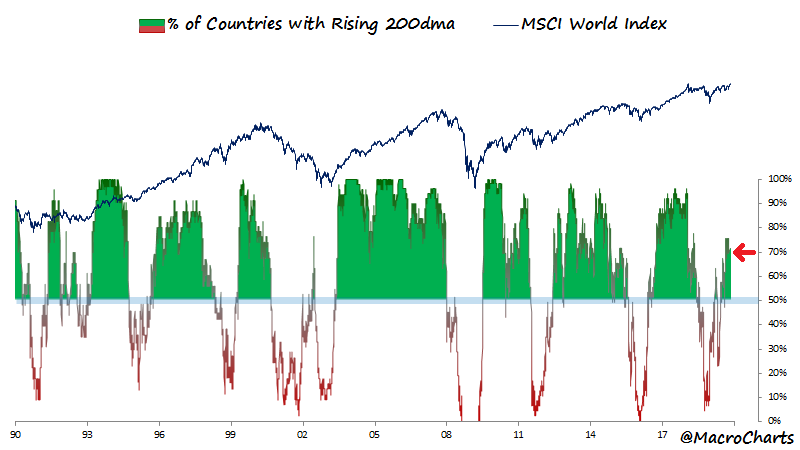
17/ And, just as importantly, it is also nice to see the percentage of stocks making 52-week highs — not just in the US — but already the world also expanding. $VT $ACWI

18/ However, I've also noticed a small spike in the number of 52-week lows recently.
Never nice to see that during uptrends, but doesn't necessarily predict gloom & doom.
I'm hoping this is just connected to stocks suffering from stronger $USD & rate proxies like REITs.
Never nice to see that during uptrends, but doesn't necessarily predict gloom & doom.
I'm hoping this is just connected to stocks suffering from stronger $USD & rate proxies like REITs.

18/ Volatility has died out right now in the US stock market...

19/ ...and the situation is quite similar in Asia too.
If it wasn't for the Hong Kong riots and the underperforming Hang Seng, this number would be even lower. $AAXJ
If it wasn't for the Hong Kong riots and the underperforming Hang Seng, this number would be even lower. $AAXJ

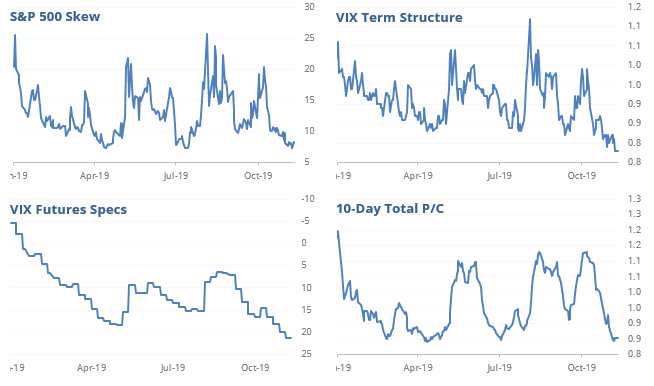
20/ During uptrends, such low volatility tends to produce rising bullish sentiment. There are a handful of indicators showing high sentiment, while another handful showing low bullish sentiment.
Put/Call ratio is definitely looking short term frothy!
Put/Call ratio is definitely looking short term frothy!

21/ Investor Intelligence survey is also starting to approach 60% bulls.
Around these lofty readings, the stock market rally tends to stall & correct. A sustained move above 60% usually markets euphoric mood & produces longer-term corrections.
Around these lofty readings, the stock market rally tends to stall & correct. A sustained move above 60% usually markets euphoric mood & produces longer-term corrections.

22/ Daily sentiment index is quite high and a potential exists for a correction.
However, more importantly, I think this indicator should have risen high. Such bearish divergences make me uneasy. $QQQ
However, more importantly, I think this indicator should have risen high. Such bearish divergences make me uneasy. $QQQ

23/ Like I said, never good to cherry-pick data. Staying objective is important.
Market Vane survey seems to show investors still dislike stocks and they are still cautious. The sentiment is as low as the previous economic slowdowns of 2011 & 2015.
Market Vane survey seems to show investors still dislike stocks and they are still cautious. The sentiment is as low as the previous economic slowdowns of 2011 & 2015.

24/ Hedge funds are also not participating in this rally. I wonder why that is? 🤔
Their equity exposure remains so low, it's if the US economy & markets went through an armageddon similar to 2002 & 2008!
Their equity exposure remains so low, it's if the US economy & markets went through an armageddon similar to 2002 & 2008!

25/ Plenty more to come on the stock markets around the world, the economy, precious metals and currencies. But first, a break!
Regards from #kualalumpur
Regards from #kualalumpur

26/ Ran out of time to finish the thread yesterday, however, I want to add some additional charts by Jason at @sentimentrader who has a great product for those that understand the importance of sentiment indicators and applying objectivity to your decision making. I use the...
27/ ...service and it has helped my trading a lot over the years!
Firstly, Trump is tweeting about the stock market again. Usually, this occurs near short term market peaks. If the momentum is strong, it can keep going for a while like late 2017.
Firstly, Trump is tweeting about the stock market again. Usually, this occurs near short term market peaks. If the momentum is strong, it can keep going for a while like late 2017.

28/ Breadth continues to give some warning signals, especially in the form of Hindenburg Omen & Titanic Syndrome warning signs.
This indicator didn't work well in 2017, but I've followed @sentimentrader advice in both September 2018 and July 2019. Helped my drawdowns!
This indicator didn't work well in 2017, but I've followed @sentimentrader advice in both September 2018 and July 2019. Helped my drawdowns!
@sentimentrader 29/ I think this indicator gets a big laugh from the financial community due to its name (or both of those cheesy names), but the track record it has had over the years tells you to at least pay attention and tighten up your risk management.
@sentimentrader 30/ Furthermore, Jason also mentioned that a 4-factor group of VOL indicators clearly show traders in the options market are very complacent. These readings are "in the bottom 3% of their range for the first time since 2007." $SPX $SPY
@sentimentrader 31/ Let us now observe some of the markets around the world, as well as some sectors within the S&P 500.
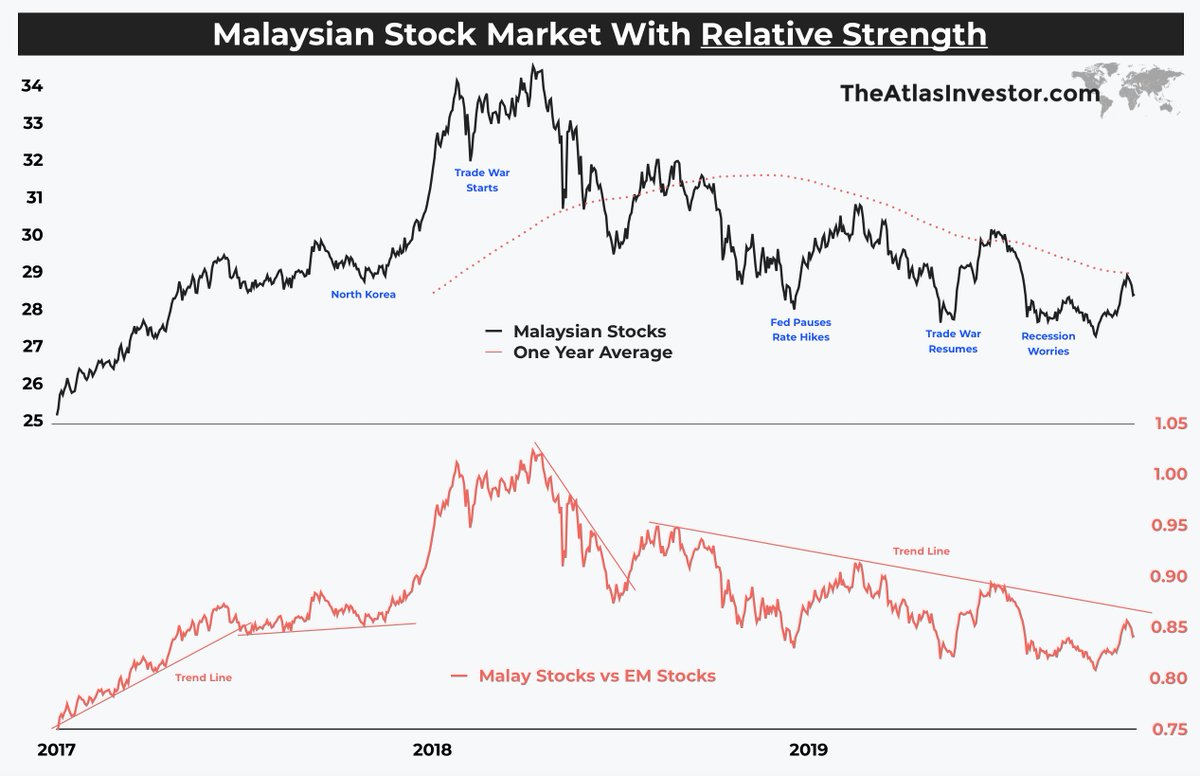
I'm writing this from KL, Malaysia where the stock market still remains below the 1-year moving average and failing to register any higher highs since April of 2018! $EWM
I'm writing this from KL, Malaysia where the stock market still remains below the 1-year moving average and failing to register any higher highs since April of 2018! $EWM
32/ On the other hand, a very much forgotten market of Nigeria, has broken out of a downtrend in recent days.
These are still early days, with no signs of a proper uptrend just yet (no higher highs, still below key MAs, momentum has been very weak). $NGE
These are still early days, with no signs of a proper uptrend just yet (no higher highs, still below key MAs, momentum has been very weak). $NGE

33/ A lot of negativity towards this market judging by the comments on yesterday's tweet. The corruption, the recession, terrorism & the underperformance isn't a secret. Everything stated is correct up to today and the market has discounted it.
34/ In the US, while the large caps and Tech sectors have been acting well, the small caps have refused to break out above their April 2019 highs (similar to Asian & EM stocks). $IWM

35/ It seems to me the Russel 2000 small caps index, which tends to be more sensitive towards liquidity, is sending a similar message to the junk bond market, credit spreads and the corporate credit default swaps. Failure to confirm the $SPY break out, at least up to this point.

36/ The good, the bad and the ugly. In the US we have some good sectors, some bad sectors, and some ugly sectors.
Energy, together with Oil drilling, exploration & services has been an awful sector over the last 12 years as well as the last 5 years. $XLE $XOP
Energy, together with Oil drilling, exploration & services has been an awful sector over the last 12 years as well as the last 5 years. $XLE $XOP

37/ While Energy sectors have been underperforming, it is hard to turn bearish while observing the cyclically sensitive semiconductor sector. $SMH

38/ Consumer discretionary sector has also been one of the key leaders in this bull market. The uptrend has been intact into July of 2019, consistently making higher highs. $XLY
However, this is now yet another sector in a non-confirmation with $SPY.
However, this is now yet another sector in a non-confirmation with $SPY.

39/ For every bearish chart, there is a bullish one. This is what makes objective market analysis so difficult.
For bulls, it fantastic to see the Homebuilders Index recover so strongly out of the December 2018 lows. $XHB
For bulls, it fantastic to see the Homebuilders Index recover so strongly out of the December 2018 lows. $XHB

40/ US Financials made new 52 week highs recently, while the regional banks broke out of the downtrend. Moreover, the Industrials sector also posted a new 52-week high. $XLF $XLI
On the other hand, US Transportation is not confirming S&P & Dow Jones breakouts. $IYT
On the other hand, US Transportation is not confirming S&P & Dow Jones breakouts. $IYT

41/ Fed's pivot in December 2018 helped precious metals increase in value meaningfully. This added fuel to the miners, which are very leveraged to the price moves of the underlying metals.
Gold Miners hit an important resistance and have sold off in recent weeks. $GDX $SIL
Gold Miners hit an important resistance and have sold off in recent weeks. $GDX $SIL

42/ After almost quadrupling in value from Jan 2016 bottom into Jan 2018 blow-off top (insane 2 year performance), the Coal country is back in a bear market. $KOL

43/ While the Health Care sector recently made 52-week new highs, the old favorite, Biotech remains in a very long consolidation phase.
Ever since the blow-off top in mid-2015, the sector has not been able to re-start its uptrend. Such enormous gains take years to digest. $IBB
Ever since the blow-off top in mid-2015, the sector has not been able to re-start its uptrend. Such enormous gains take years to digest. $IBB

44/ Finally, I want to finish with one of the strongest sectors in the US — Consumer Staples.
Currently going through one of the strongest uptrends and underpinning the strength of the recent breakout. $XLP
Currently going through one of the strongest uptrends and underpinning the strength of the recent breakout. $XLP


