Analysis: #NASDAQ $EIDX
Case 141 #EidosTherapeutics Inc (Revisited 01)
DISCLAIMER: The analysis is strictly for educational purposes and should not be construed as an invitation to trade.
Thread 👇👇👇
#EIDX 1/3
Case 141 #EidosTherapeutics Inc (Revisited 01)
DISCLAIMER: The analysis is strictly for educational purposes and should not be construed as an invitation to trade.
Thread 👇👇👇
#EIDX 1/3

Chart 1
Weekly Chart: Since peaking at 66.56 price has seen it's longest correction ever finding #support at the weekly #SMA 20. #Resistance at 60.46 is quite formidable and further 68.10. The long term target is 71.30.
EIDX 2/3
Weekly Chart: Since peaking at 66.56 price has seen it's longest correction ever finding #support at the weekly #SMA 20. #Resistance at 60.46 is quite formidable and further 68.10. The long term target is 71.30.
EIDX 2/3
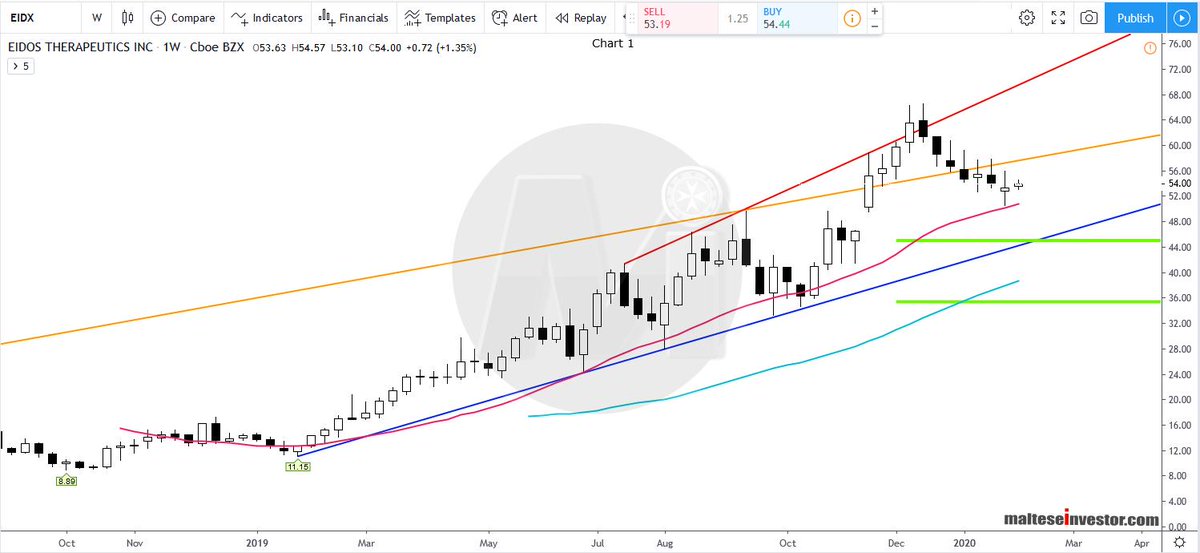
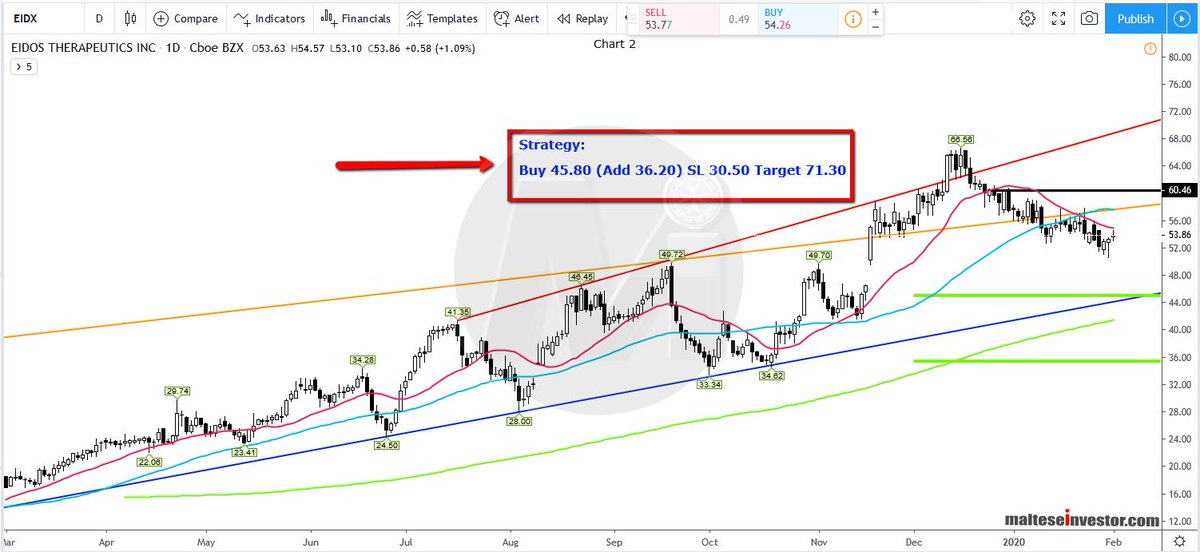
Chart 2
Daily Chart: The #SMA 20 has cut below SMA 50 and we expect price to reach the bottom part of the gap and #trendline support.
The #Strategy is printed on the image.
$EIDX 3/3
Daily Chart: The #SMA 20 has cut below SMA 50 and we expect price to reach the bottom part of the gap and #trendline support.
The #Strategy is printed on the image.
$EIDX 3/3