My Authors
Read all threads
We have borrowed against our future, consumed most of the resources yesterday, and now face a shrunken present and an absolutely uncertain future.

Our Minsky Moment has been decades in the making. This is where we are & where do we go from here.
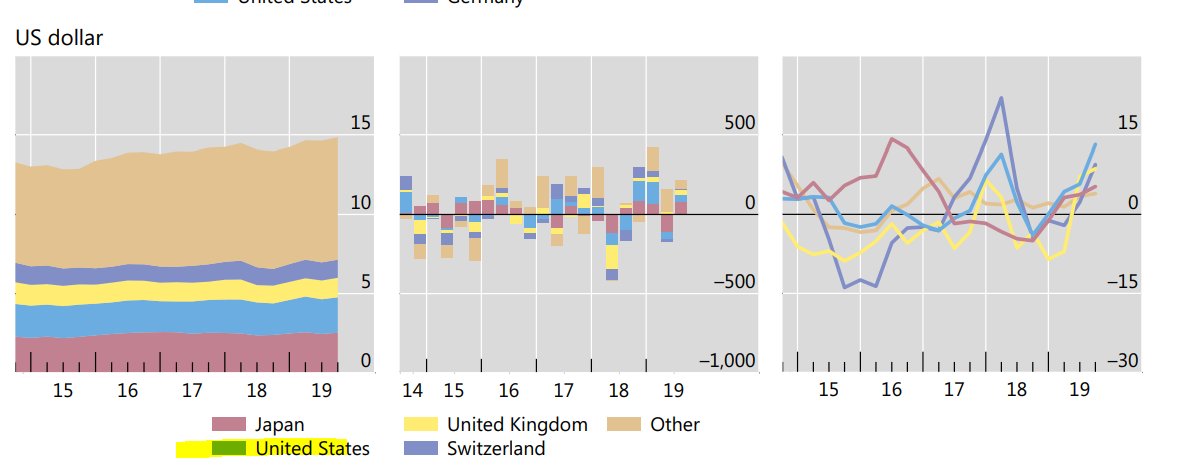
Cross border claims by nationality of reporting banks & by currency via @BIS_org March 2020 report:

Look at the size of Japan (>US banks) + France + ESPECIALLY OTHER in USD.

Meaning, NON US BANKS LENDING A LOT OF USD & they now got a liquidity problem & need access to cheap USD
Global debt securities market - notice that largest issuance is in USD & why the USD is key
Global OTC derivatives markets (US GDP is 21trn)
Look at the size of OTC foreign exchange derivatives in USD - massive!!!!
Look at OCT interest rate derivatives, again, massive in USD but EUR also big
USD dollar credit outside of the US - been growing a lot since the GFC!
Global credit to the non-financial sector in USD - massive!!!
Dollar credit to non-banks outside the US about USD12trn & most of the increase is via bond issuance
Non-financial DEBT in Asia as a share of GDP - massive increase for Hong Kong, Singapore, China and Korea.

ASEAN & India less bad but Malaysia & Thailand high.
And of course, the one most impacted by the corona virus & also most vulnerable as unlikely to be able to access free funding from CBs: HOUSEHOLD DEBT.

Look at the big increase for China & the high level for South Korea!
And the mother of all household debt is SWITZERLAND. In Asia, it is Australia (have delevered some but still at 120% of GDP). Canada looks dicey.

US households delevered.
Next level of vulnerability is obviously is at the firm level:

Again, high for Hong Kong, China, Korea and Singapore.

Clearly Singapore firms more shaky than Singaporean households!!!
Debt service ratios for private non-financial (the change u see is deviation from norm) and Hong Kong is worsening!!!

China is worsening too but more gradual esp relative to Turkey (although Turkey improved vs itself!)
Debt service ratios for HOUSEHOLDS & check out Canada, Australia, and South Korea worsening.

In Europe, it's Norway & Sweden.
Look at the serviceability of firms (private & non-financial): Canada stands out as WORSENING.

US is good but worsening slowly!!!
Missing some Tweet in this thread? You can try to force a refresh.

Enjoying this thread?

Keep Current with Trinh Nguyen

Profile picture

Stay in touch and get notified when new unrolls are available from this author!

Read all threads

This Thread may be Removed Anytime!

Twitter may remove this content at anytime, convert it as a PDF, save and print for later use!

Try unrolling a thread yourself!

how to unroll video

1) Follow Thread Reader App on Twitter so you can easily mention us!

2) Go to a Twitter thread (series of Tweets by the same owner) and mention us with a keyword "unroll" @threadreaderapp unroll

You can practice here first or read more on our help page!

Follow Us on Twitter!

Did Thread Reader help you today?

Support us! We are indie developers!


This site is made by just three indie developers on a laptop doing marketing, support and development! Read more about the story.

Become a Premium Member ($3.00/month or $30.00/year) and get exclusive features!

Become Premium

Too expensive? Make a small donation by buying us coffee ($5) or help with server cost ($10)

Donate via Paypal Become our Patreon

Thank you for your support!