Have you ever felt that you have lived the present situation before? Its called #Déjàvu. Right now I'm experiencing this moment in the markets. #PSUBanks are going through tough times. But this isnt new. They were in a similar situation back in 2016. (1/n)
#PSUBanks were dealing with NPA's and losses in Mar 2016. Their troubles are amplified after the #COVIDー19 outbreak. But it seems worst is over. Here's a weekly chart of #NiftyPSUBank index. (2/n) 


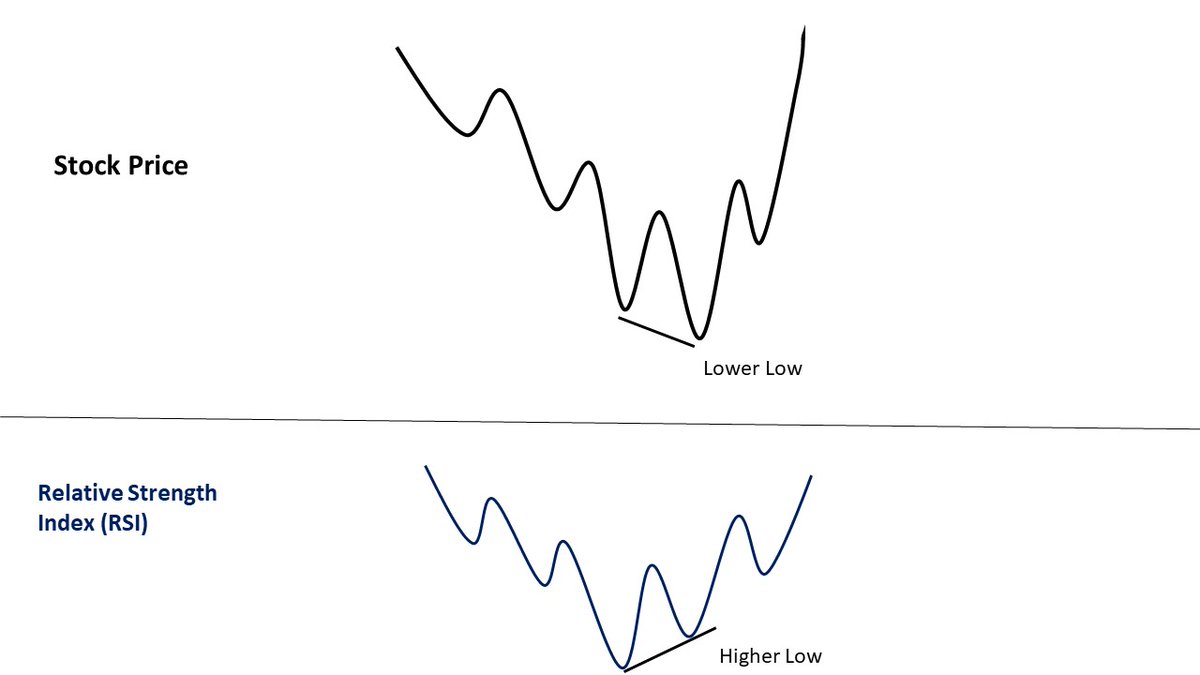
#PSUBanks are forming bullish divergence in #RelativeStrengthIndex(RSI) on weekly charts. #RSI is a momentum indicator. Bullish divergence in it indicates that ongoing downtrend is losing steam. It doesnt guarantee a reversal but increases the chances. (3/n) 

If you want to know how to trade the #RSI #divergences then you can read my detailed article on Contrarian Trading with the RSI I wrote back in 2016 here - tinyurl.com/y2zwxoaz (4/n)
Now here's the fun part. Several #PSUbank stocks are also forming similar pattern on the weekly chart. I'm sharing them all. Disclosure: You must not take this as an investment recommendation. These are for educational purpose only.
(5/n)
(5/n)
#StatebankofIndia #SBIN - the most hated stock in the market right now. Do check out my tweet on the #greedandfear cycle in #SBI as well - 
https://twitter.com/apurvansheth/status/1299538165238177792

#BOB #BankofBaroda - its an exception as there wasnt any divergence back in 2016. But look at the #divergence now - MASSIVE. 

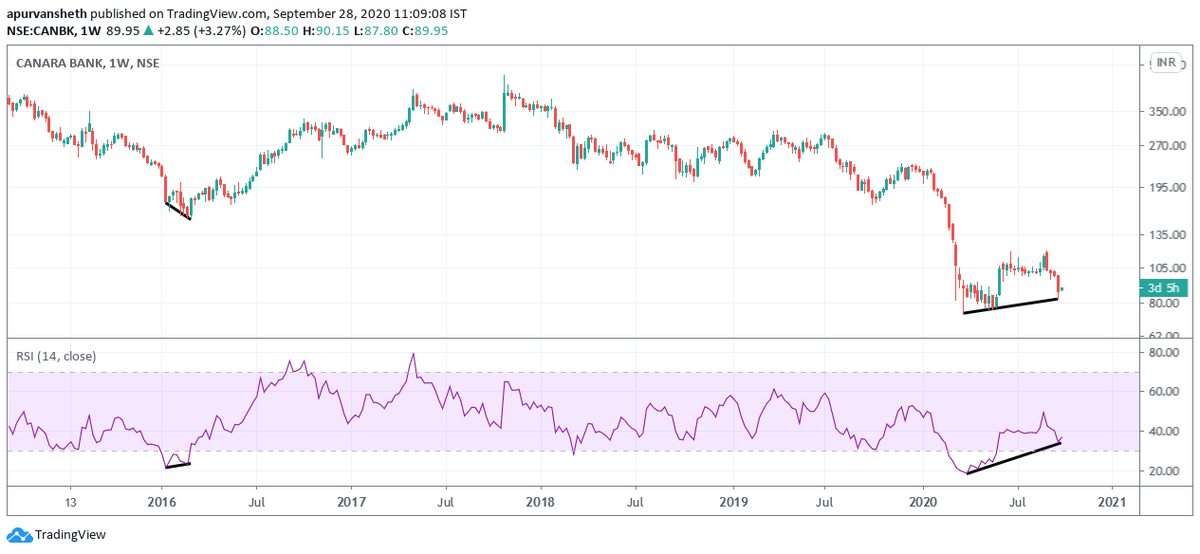
#CANBK #Canarabank - the divergence in 2016 was tiny. But look at the divergence now and that too from a deep oversold levels. 

Here's how #PSUBanks fared for me back in 2016.
My Contrarian Trades in the PSU Banking Space - tinyurl.com/y5zpvls8
My Contrarian Trades in the PSU Banking Space - tinyurl.com/y5zpvls8
And cherry on the top is the #ratio chart of #BankNifty to #Nifty which is forming a bullish divergence with #RSI and is placed near major support level of 1.90. 

• • •
Missing some Tweet in this thread? You can try to
force a refresh


