Anyone perusing the top articles of major media outlets last weekend would have read several pieces on the extraordinary #shortages being witnessed in the U.S. #economy today, and particularly those in the #labor market.
The tone of many articles was pessimistic, suggesting that the #supply-side #shortages and dislocations may be systemic, or long-term, but we think there’s evidence that the U.S. #economy will display considerably greater dynamism and resilience than the pessimists believe.
First, it’s vital to recognize that this is a #supply constraint problem, not one of #demand. Indeed, strong demand is being driven by a host of powerful influences: 1) household balance sheets never been cleaner and HH #wealth is $25 trillion greater now than pre-Covid level.
Further, 2) personal #savings has never been greater, with excess savings now more than 12% of GDP, and 3) household #incomes are also at record highs (and climbing fast), even over and above the recently outsized federal transfer payments.
And while #CorporateProfitMargins may well experience some near-term degradation, broadly speaking, 4) the #corporate sector is in solid shape, with strong #cash flows and having termed-out #debt at historically low rate levels.
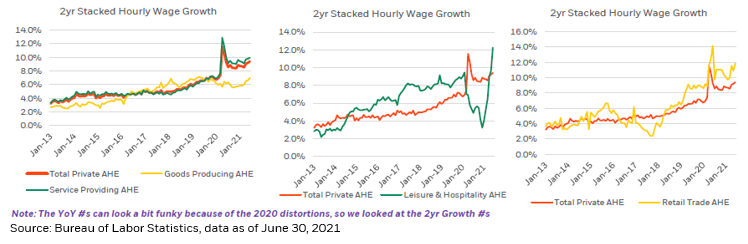
Thus, with these kinds of tailwinds, it’s not surprising to see demand for #labor so high! Existing #workers are putting in more hours, employers are raising #wages and still job openings remain at series highs.
Remarkably, all that is in the context of a labor #market in which total nonfarm employment is nearly 5 mil. lower than the pre-pandemic Feb 2020 level, and household #employment is down roughly 3 mil., with the labor force participation rate more than 2 pct. pts. lower.
The fact is that the Q3 surge in the Covid delta variant caused a mini #LaborMarket shock, arresting what had been solid #job growth in Q2, but now as case counts plummet and vaccines/boosters expand that is likely to reverse.
Moreover, we think it’s likely that transfer #payments and UI #benefits have heretofore enabled workers to refrain/delay reentry to the #labor force, but now that these top-ups have ended, return to work should become more pronounced.
Astoundingly, in August 2021 alone, aggregate #UI benefits were 15% greater than the full 12-month period that led up to the pandemic, and transfer #payments were 67% greater that month than they were in Feb. 2020! That is dramatically changing…
…which should redound to the benefit of #LaborMarket supply, helping to alleviate the #CapacityConstrains we face as we enter Q4 and into 2022. Obviously, it won’t happen overnight, but in time the Beveridge Curve should normalize toward prior levels.
An admittedly untested, but nonetheless interesting, indicator that this process could already be taking place is the fact that search #trends on #Google finally show that more people are looking for “job” than “unemployment” for the first time since the start of the pandemic.

• • •

Missing some Tweet in this thread? You can try to force a refresh
 

Keep Current with Rick Rieder

Rick Rieder Profile picture

Stay in touch and get notified when new unrolls are available from this author!

Read all threads

This Thread may be Removed Anytime!

PDF

Twitter may remove this content at anytime! Save it as PDF for later use!

Try unrolling a thread yourself!

how to unroll video
  1. Follow @ThreadReaderApp to mention us!

  2. From a Twitter thread mention us with a keyword "unroll"
@threadreaderapp unroll

Practice here first or read more on our help page!

More from @RickRieder

13 Oct
With respect to today’s #inflation data, core #CPI (excluding volatile food and energy components) came in at 0.24% month-over-month and 4.04% year-over-year and was driven higher by strong increases in the #rent components, which have a tendency to be persistent.
Further, headline #CPI data printed at a solid 0.41% month-over-month and came in at 5.38% year-over-year.
Today’s data witnessed declines in used vehicles, #airfares and lodging, which should temper #market concerns somewhat, but we anticipate that these components are likely to see #prices bounce back in the months to come.
Read 10 tweets
8 Oct
September witnessed a somewhat disappointing nonfarm #payroll gain of 194,000 jobs, which was weaker than the upwardly revised August gain of 365,000 and was well below #economists’ consensus estimates of nearly 490,000 jobs.
Clearly, there are significant #labor supply issues limiting the pace of recovery. Further, the #unemployment rate declined meaningfully, from 5.2% to 4.8% in Sept, and average hourly #earnings saw gains of 0.62% m-o-m, which brings the measure to 4.58% greater on a y-o-y basis.
The most interesting part of today’s #JobsReport, and much of the other recent #economic/corporate data, is that it’s the supply of resources that’s creating systemic pricing pressure, as well as consequently dulling growth of an #economy not lacking demand in virtually any area.
Read 11 tweets
23 Sep
As expected, the @federalreserve’s Federal Open Market Committee continued to discuss its plans to reduce, or #taper, the pace of its #AssetPurchase program at yesterday’s meeting.
While the details of this discussion were fairly sparse, the Committee statement did state that: “If progress continues broadly as expected, the Committee judges that a moderation in the pace of asset purchases may soon be warranted.”
Further, at the recent #Fed conference in Jackson Hole, Wyo., and at the press conference, Fed #ChairPowell emphasized that both he and most Committee participants now consider the test of “substantial further progress” toward the #inflation mandate to be largely satisfied.
Read 10 tweets
14 Sep
In August we saw #inflation growth moderate further, for the second consecutive month, at least relative to the impressive rate of growth in #prices witnessed around mid-year.
Core #CPI (excluding volatile food and energy components) came in at 0.10% month-over-month and 3.98% year-over-year, which was considerably less than the consensus forecast and was driven higher by #shelter components.
Meanwhile, headline #CPI data printed at a solid 0.27% month-over-month and came in at 5.20% year-over-year.
Read 11 tweets
27 Aug
It was 73 degrees and sunny in #JacksonHole, Wyoming, today; a perfect day for all those who were there….
Yet, there were no #monetary policy officials present at the traditional location of the @KansasCityFed’s late-summer #economic policy symposium, since they were conducting a “virtual symposium.”
That symposium provided #ChairPowell the opportunity to lay out a reasonably sunny perspective on the U.S. #economy, but also one that was not out of the woods yet, in terms of Covid variant risk and a maximum #employment target still to be achieved.
Read 10 tweets
11 Aug
Inflation data for July moderated somewhat, at least relative to the heady pace of recent months, which should temper #market and policymaker concerns a bit, despite the fact that #inflation will stay sticky-higher for a while and the #risk remains to the high-side.
Core #CPI (excluding volatile food and #energy components) came in at 0.3% month-over-month and 4.3% year-over-year, a bit less than the consensus forecast, and headline CPI data printed at a solid 0.5% month-over-month and came in at 5.4% year-over-year.
While we think that it’s hard to see a case for the recent levels of elevated #inflation turning into “1970s style” runaway price increases, higher #wages and elevated growth for an extended period will allow companies to achieve higher levels of #PricingPower for a time.
Read 7 tweets

Did Thread Reader help you today?

Support us! We are indie developers!


This site is made by just two indie developers on a laptop doing marketing, support and development! Read more about the story.

Become a Premium Member ($3/month or $30/year) and get exclusive features!

Become Premium

Too expensive? Make a small donation by buying us coffee ($5) or help with server cost ($10)

Donate via Paypal Become our Patreon

Thank you for your support!

Follow Us on Twitter!

:(