Profile picture
Charles Stewart @cstewartiii
, 4 tweets, 1 min read Read on Twitter
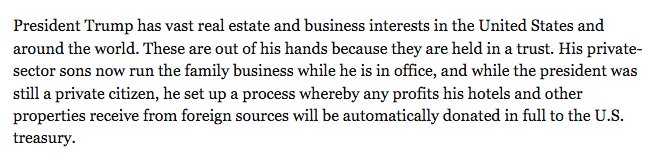
Two graphs to illustrate the key take-aways from the #OH12 special election.
First, Balderson's % plotted against Trump's % by county in the district. (The Trump numbers are only from precincts in the 12th dist.) Balderson just a little less than Trump in each county. (Circles ~ to turnout.)
Second turnout in each county plotted against Trump's % in those counties. (Again, only looking at precincts in the 12th dist.) Biggest drop-off in strongest pro-Trump counties.
This is probably not a story of shifting sentiments so much as shifting mobiliziation, interest, enthusiasm, etc.
Missing some Tweet in this thread?
You can try to force a refresh.

Like this thread? Get email updates or save it to PDF!

Subscribe to Charles Stewart
Profile picture

Get real-time email alerts when new unrolls are available from this author!

This content may be removed anytime!

Twitter may remove this content at anytime, convert it as a PDF, save and print for later use!

Try unrolling a thread yourself!

how to unroll video

1) Follow Thread Reader App on Twitter so you can easily mention us!

2) Go to a Twitter thread (series of Tweets by the same owner) and mention us with a keyword "unroll" @threadreaderapp unroll

You can practice here first or read more on our help page!

Did Thread Reader help you today?

Support us! We are indie developers!


This site is made by just three indie developers on a laptop doing marketing, support and development! Read more about the story.

Become a Premium Member and get exclusive features!

Premium member ($3.00/month or $30.00/year)

Too expensive? Make a small donation by buying us coffee ($5) or help with server cost ($10)

Donate via Paypal Become our Patreon

Thank you for your support!