,
24 tweets,
9 min read
Read on Twitter
A widespread perception around #MTBPS2018 today is that there are too many public servants, who're paid too much, & that we can only afford to expand services/investment if these costs are cut back. But check this 👇 thread, & see whether this is in fact correct @Zwelinzima1 
Despite having to extend services to a large population historically excluded from many services, the numbers employed by government (local provincial & national) compared to the numbers employed under apartheid has not significantly increased as a share of total employment.

There was a reduction of 203 000 public service jobs between 1995-99. While those cutbacks were subsequently reversed, this was not done on a scale which kept pace with the growth in the economy, the population, or service delivery requirements.

Measured against size of population, SA’s public sector is actually small by international standards. World Bank (2015) estimates public sector workers (including SOEs) only constitute 3.1% of the population, which is very low when compared to the middle income average of 6%.
IMF, for a different period, estimate public sector employment for middle income countries at 6.8%. Both estimates, using population size as a benchmark -> our public sector is comparatively small. SOE employment ratio-0,6%- is way below ratio for middle income countries of 3%.

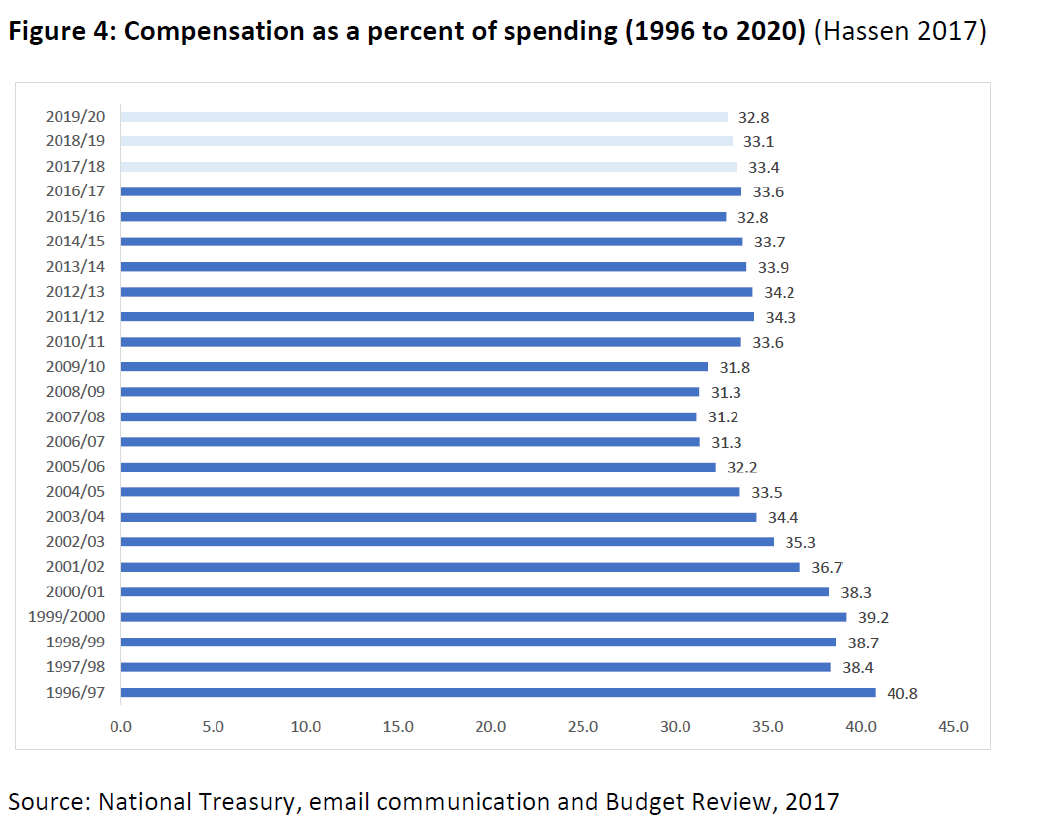
Picture is mixed depending on benchmark used. SA public sector consumes a relatively high %of the national budget/ GDP -result of various factors:growing high skills &managerial profile of the sector, improvement in pay &conditions & a bloated bureaucracy at top of public service

Further, the low levels of growth of the economy, low levels of tax revenue and restrictive budgetary policies, combine to ensure that the relative share of public sector pay, is higher than it would be in a more expansionary and growing economy.
There is a dire shortage of service delivery workers, large no.s of unfilled posts or vacancies, &measures to freeze or cut back on posts. Govt data: 200 000 vacancies in 2016. Vacancies & skills shortages may be far greater than this figure according to Public Service Commission

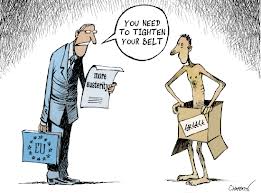
Expenditure ceilings, freezing of posts, over recent years have reduced numbers of vacancies being filled. ‘Compensation ceilings’ were reduced by R10 billion in 2017, and R15 billion in 2018, i.e. imposing effective cuts to the wage bill. This is expected to worsen in 2019.
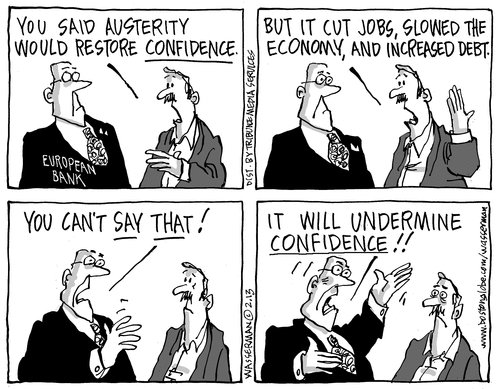
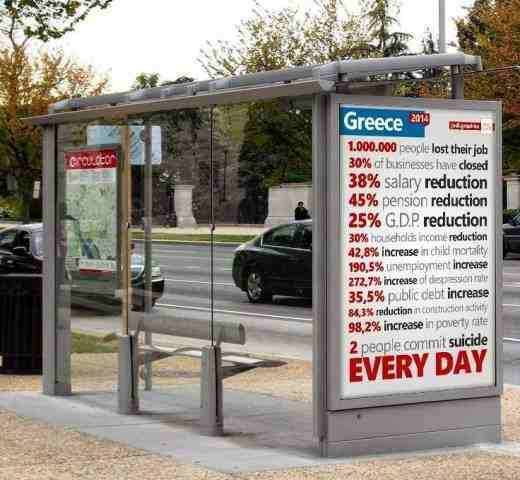
Fiscal #austerity is also squeezing out other forms of expenditure, on which public servants rely (medicines, infrastructure, books etc), as the envelope shrinks. Crisis measures such as the employment of temporary teachers, compromise the quality of delivery.
Composition of the wage bill, & the PS employment profile, is NB. A growing proportion goes to the top 6 grades -> misallocation of resources to administration which is insufficiently connected to service delivery, high wage gaps, &inadequate resources going to frontline services


In numerical terms, increase in top grades seems small but in %(& cost) terms, increase in high-skilled &managerial posts, is very pronounced. The cost of these posts is high. Top echelons (levels 11-16)absorbed 15% of salary costs in 2016/17, but are less than 6% of workforce.
Although teachers, nurses police are 55% of all workers -only accounted for 40% of increase in jobs 2006-2009. High Skilled Supervision sector has grown from 6% of employment in 2001 to *18% in 2016*: more rapid employment of those in the higher grades, & office based staff.
Increase in highly-paid posts at top of bureaucracy is only 1 reason for sharp rise in employment costs. Have also risen for +ve reasons: eg intro of OccupationSpecificDispensation to attract professionals to public service;&strength of unions in winning improved wages/conditions
But these improvements are counteracted by difficult conditions under which frontline workers operate: shortages of staff &infrastructure, worsened by budget cutbacks. Create intolerable working environments in schools, health care facilities, police stations, frontline offices.
An element of this pressure is the lack of proper administrative support to allow the professionals to concentrate on their core functions.
Many low skilled jobs were regraded, removed from public service or outsourced. Shift from entry level unskilled jobs was expedited by move away from employment in the bottom 4 grades & the consolidation of many of the low-paid jobs, including many clerical workers, into Grade 5

Challenge of pub service jobs is not just one of economic growth/fiscal space. Public service unsuited to delivering its developmental mandate. Need strategy to reconfigure the public service. Capable state requires having right numbers of trained/resourced people in right places
Building a capable state means substantially expanding certain areas at the coalface of delivery, but also contracting other areas, particularly elements of the bureaucracy that are not productive.
Evidence suggests there is no direct relationship between GDP growth &public sector employment. Periods of high GDP growth – eg 2000-2006 – saw little public jobs growth. Largest expansion in public sector jobs took place after global crisis –acting as a countercyclical cushion

Public Sector growth not uniform at national provincial &local levels. Even during high public service growth, jobs numbers have contracted in some areas – jobs shrinking in the poorest rural provinces. These economies rely more heavily on public sector employment.

More remote provinces/rural areas battle to attract key skills. Eg, in W Cape & Gauteng, there are 14.7 & 12.6 physicians per 10 000 people, comparing well with middle-inc countries. But Limpopo has only 1.8 doctors per 10 000 - only slightly above average for sub-Saharan Africa
Any strategy to reconfigure and 'rightsize' the public service needs to be based on these realities outlined above, and not on ideological posturing. Having considered these factors the @IEJ_SA suggested a number of proposals to address these challenges (summarised here) 👇
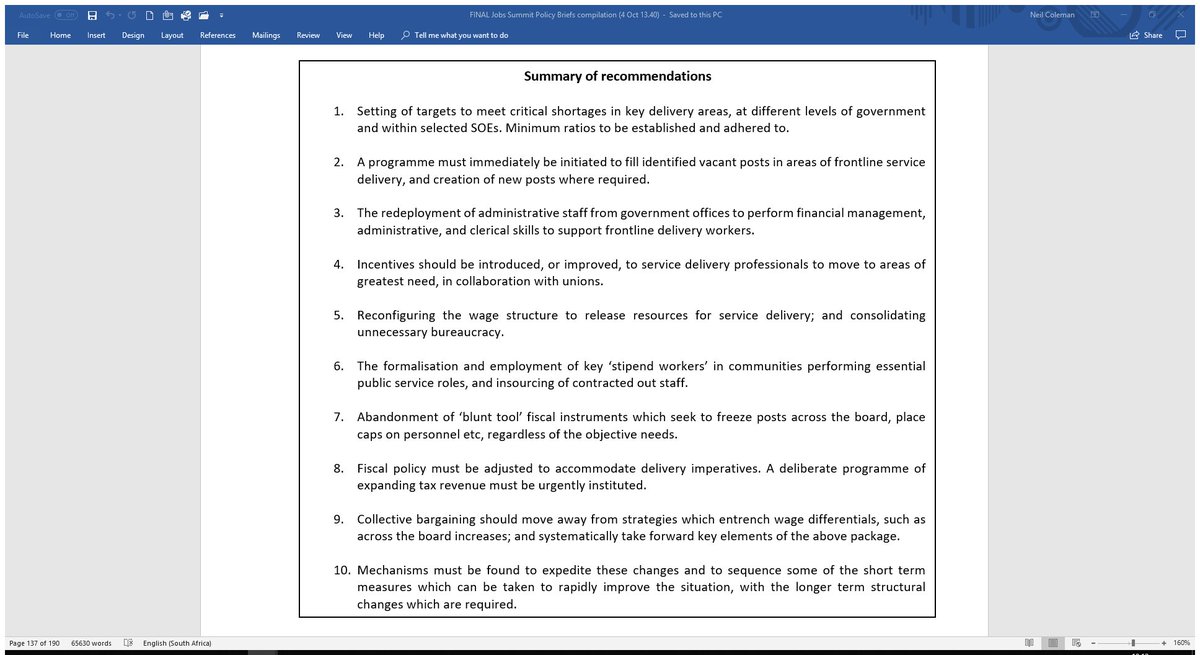
The *full @IEJ_SA policy brief*, plus a comprehensive statistical annexure, on which this thread is based, is available here, pp 133-168:
goo.gl/TwRsPW @RediTlhabi @ferialhaffajee @politicsblahbla @Eusebius @StephenGrootes @XoliMngambi @TimModise @JohnPerlman
goo.gl/TwRsPW @RediTlhabi @ferialhaffajee @politicsblahbla @Eusebius @StephenGrootes @XoliMngambi @TimModise @JohnPerlman