THREAD: We have just released an unprecedentedly detailed mapping of NO2 pollution levels around the world, revealing the worst pollution hotspots and showcasing the power of a new generation of smog-tracking satellites. Interactive map: energydesk.carto.com/builder/4c2ece… 
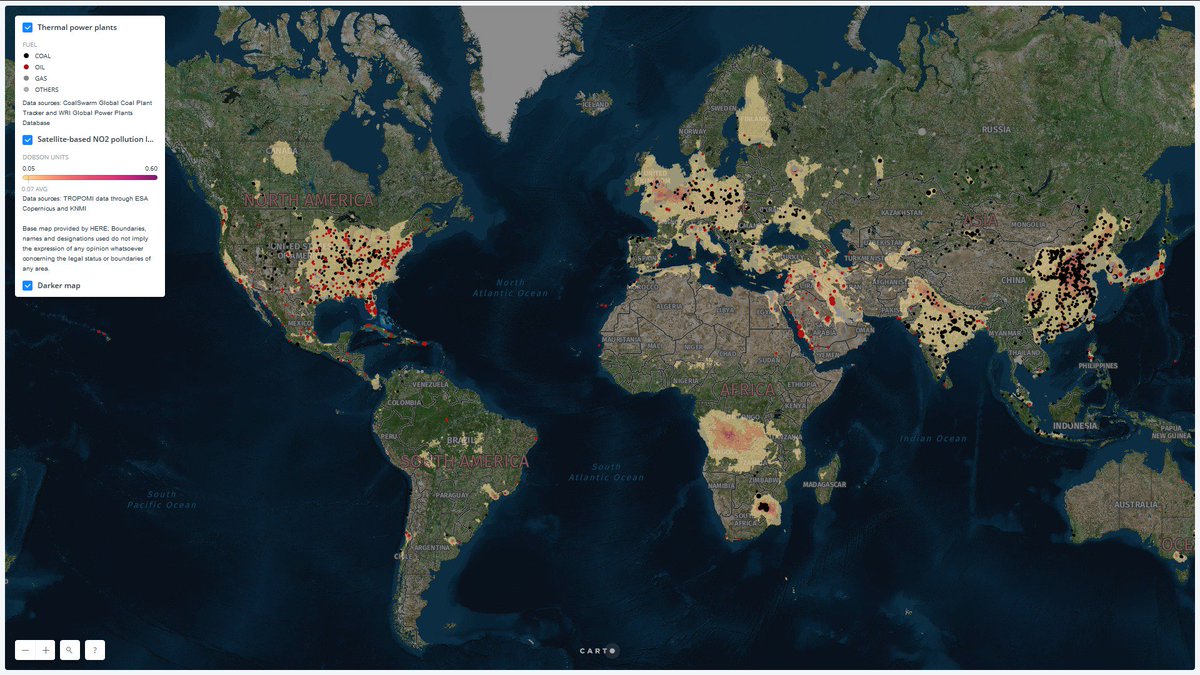
Press release: greenpeace.org/international/…
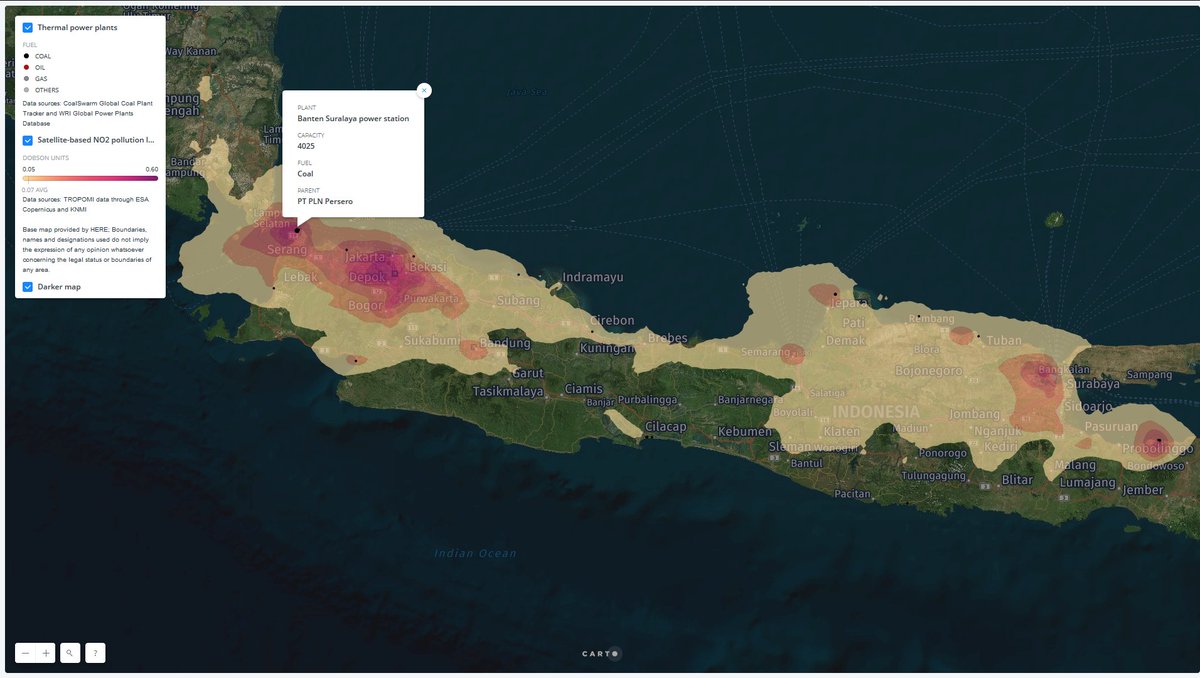
The new TROPOMI instrument onboard the @esa Sentinel 5P satellite gives us unprecedented detail on atmospheric pollution levels, revealing the largest sources in an area. See the hotspots here around several highly polluting coal plants on Java, Indonesia.
Why does nitrogen dioxide (NO2) matter? It's a deadly pollutant in and by itself, responsible for an estimated 75,000 premature deaths per year in the EU alone, and a key ingredient in the formation of PM2.5 and ozone, the two air pollutants with largest global health impact.
10 of the worst 50 hotspots are found in China, 8 in the Middle East-North Africa region, 4 in the EU, 3 in India, U.S. and Congo each, and 2 in Japan. Majority of hotspots are dominated by emissions from power plant emissions (coal and oil), industry and transport.


The world's most polluting power plant cluster is found in Mpumanlanga, South Africa, a stone's throw from Johannesburg. Yet the state utility has been fighting a fierce rear guard battle to delay or avoid installing emission controls in these power plants.

This instant snapshot of pollution levels clearly shows plumes from Eskom's power plants getting blown into Johannesburg and Pretoria. Denial of the impact of the power plants on air quality in the megacities has characterized the debate in the country.

The worst industrial emissions hotspot is, drum roll, the Tangshan steel industry mega cluster bordering Beijing. NO2 emissions levels across eastern China's industrial regions remain stunningly high despite years of efforts to tackle air pollution.
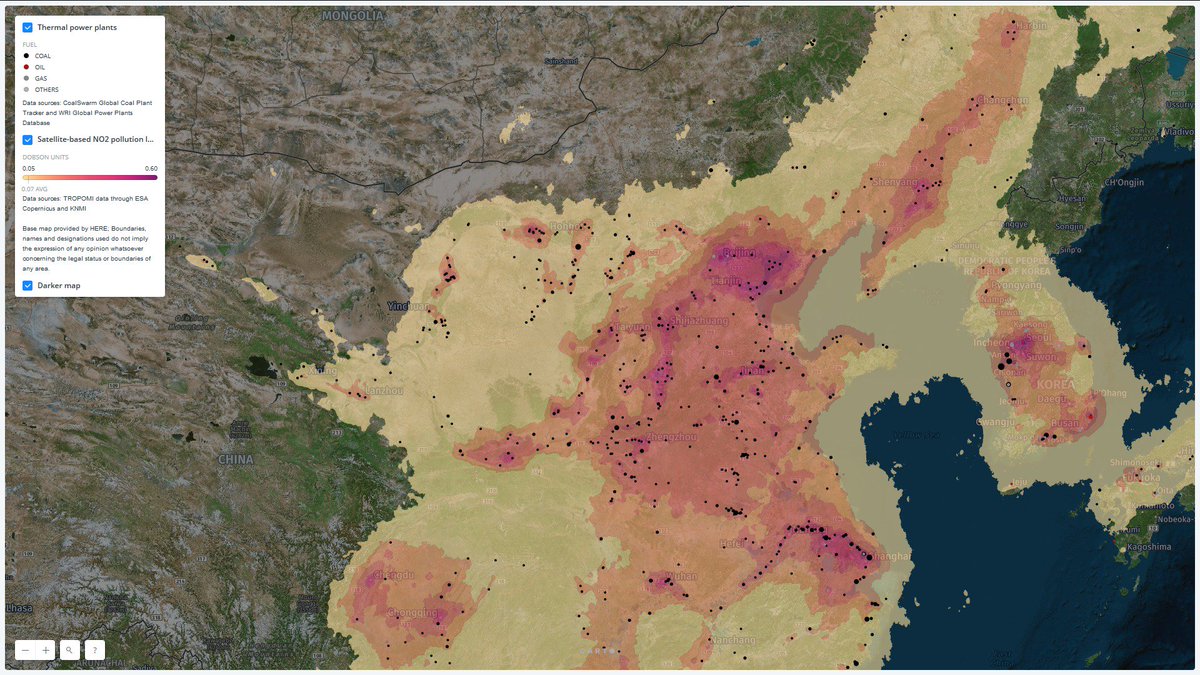

I hope this data for China will be a demonstration of the power of an objective "eye in the sky" - I've heard a lot of policymakers and experts in China say that they believe power plant and industrial emissions are already "taken care of" and focus should be on other sectors.
The worst hotspot in Europe: the lignite-burning region of North Rhineland in western Germany. The area has lots of industial and transport emissions as we as power plants, but plotting daily snapshots clearly shows the plumes from the monstrous lignite polluters.


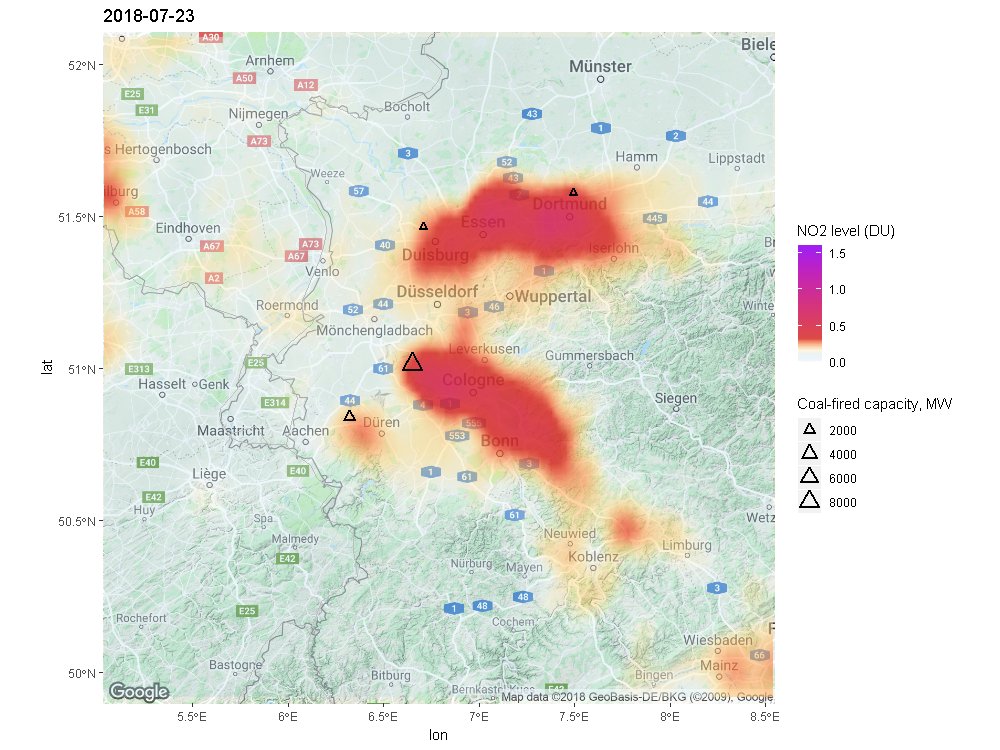
Notice how the data shows pollution from German lignite plants getting blown right across the border into France, and towards the major German cities.
Some of the worst transport-related pollution hotspots are found in Santiago de Chile (also the worst hotspot in Latin America) and Seoul. These comparisons of weekend and weekday pollution levels clearly show the role of transport:


Another country with a very highly polluting coal power fleet that has delayed enforcing meaningful emission limits - India. Besides Delhi, largest hotspots are invariably found around coal power clusters. Also see pollution from Dadri thermal plant blown into Delhi on Jun 1.


One of the most striking findings for me was fossil-fuel pollutant emissions in Middle East and North Africa. Reasons include very highly polluting transport sector, huge oil-fired power plants with very poor emissions controls, and refineries.

See these plumes from multiple oil-fired power plants around Riyadh, Saudi Arabia that trump even transport emissions from the city.

Besides fossil fuels, forest fires and agricultural burning stand out on the map, e.g. in Congo and far eastern Russia.
In conclusion - fossil fuels are taking an enormous toll on air quality and public health around the world, and new tools are leaving polluters nowhere to hide. Transition to clean energy and strong emission standards for power plants, vehicles, industry urgent challenges.
We and others are just getting started using this data to pin down pollution sources in different countries and regions - potential is enormous with more sophisticated algorithms.
The @WHO is releasing a new report today on the devastating impact of #airpollution on #children's health. Our work shows the polluters who need to be made to clean up or put out of business to tackle the pollution crisis. #CleanAir4Health #cleanair