
You know that Guardian story about China and Russia and Canada causing 5°C of global heating by 2100? Well I went and read the actual paper that it's based on. theguardian.com/environment/20… 1/
Brace yourself, this is a monster 50+ tweet thread. The TLDR is: no they're not, and that graphic is spectactularly misleading. 2/
I read the article last night (it was the top story on the international version of the Guardian website all yesterday evening) and something smelt funny about it so I've spent much of today going through the paper itself with my equally nerdy partner. 3/
We're not economists or climate scientists, and the paper is dense, so this wasn't easy, but I think we've got it more or less figured out. Not 100%, but close enough for me to do my best at a walk-through. 4/
You can read the paper too, it's right here: nature.com/articles/s4146… Here is the University of Melbourne's write-up (clearer than the Guardian's): pursuit.unimelb.edu.au/articles/who-s… 5/
Ok, here goes. First of all, this paper is written from a very specific perspective on sharing out reductions in greenhouse gas emissions. Whether or not you think it's correct, you need to know what it is if you want to understand the paper. 6/
As you might know if you've ever thought about it for more than ten seconds, there are various ways for a country to assess its greenhouse gas emissions and to calculate how much it needs to cut them in order for global targets to be met. 7/
Some emphasise past emissions, some emphasise per capita equity, some seek to facilitate the economic development of poorer countries. The Paris Agreement apparently allows countries to pick which method to use. 8/
The authors of the paper take the following view on this: 9/ 

What this means is: we should assume that every country is going to calculate their share of emissions reductions targets using the method that minimises their reduction targets. 10/
So, the authors worked out how each country would set its targets if they use the calculation method (of the five considered in the paper) that allows them to keep emitting as much as possible. 11/
(This bit of the paper is complicated and I don't totally get it because it seems like some of the national targets potentially depend on other countries' targets, but alright, let's keep going). 12/
Unsurprisingly, in their model this leads to scenarios where the world as a whole does not make the required emissions reductions, and warming goes up more than we want it to: even if we are all supposedly aiming for 2 °C, we actually hit 2.3 °C. 13/
Makes sense so far, right? If every country gets to choose how it calculates its emissions reductions according to a selection of possible methods, and every country goes for the minimum possible reductions, we're in trouble. 14/
This conclusion looks like a good contribution, I think, of this paper. So. How to fix this problem? 15/

The authors suggest that, rather than figuring out a fair way to spread emissions cuts, and enforce them, we should just change the original temperature targets so that, even with countries playing the system, we can still stay below 1.5 °C or 2 °C. 16/
So, they take the model they have used for each country's emission targets, and then lower the original target from 1.5/2 °C until the actual outcome of the model reaches 1.5/2 °C. This means changing to targets of 1.1 °C or 1.3 °C respectively. 17/
Ok, to be honest, I'm not sure about giving up on the idea of finding and agreeing on a fair way of dividing up emissions reduction targets. But let's go with it. 18/
You can check their modelled emission targets for each country (to stay below 1.5 °C or 2 °C even with countries choosing their own methods of calculating national targets) in their Supplementary Data 1 static-content.springer.com/esm/art%3A10.1… 19/
There are errors in the sheets giving percentage changes in emissions in the SD, by the way. There are extra row labels at 'EU28' 'G8+Chn' and 'RotW'. You have to delete those extra row labels and shift the remainder upwards to read the numbers accurately. 20/
But for the 1.5 °C target, unless I'm missing something, they appear to suggest that Brazil should reach zero emissions by 2043, whereas Germany has until 2058 and India has until 2100. 21/
These are, arguably, rather weird targets. But this is the outcome of the model they've created by assuming that countries will game the system and then trying to game it back at them. 22/
Alright, so that's that. Then they do something else. 23/
They take various climate change scenarios, from 1.2 °C to 5.1 °C heating by 2100, and look at the modelled 2030 emissions in each of those scenarios. Then they fit their model of national shares of emissions reductions to those 2030 emissions numbers. 24/
For example, for 3.3 °C of warming, the SSP2-60 scenario reckons on global emissions of 57.9 gigatonnes of CO2 equivalent (according to their Supplementary Table 4). 25/
They take their models for sharing out emission reduction targets, and as far as I can figure out, shift all the curves in their model so that we have global emissions hitting 57.9 GtCO2eq in 2030. 26/
So. They've decided on one, not necessarily entirely fair, way of sharing out emissions reductions between each country, and modelled how we can divide up emissions in order to get us to anywhere between 1.2 °C and 5.1 °C of heating by 2100. 27/
Then they look at what is currently pledged by each country for 2030, and compare it against those models. (Pledges from, I think, here: climatecollege.unimelb.edu.au/ndc-indc-facts…) 28/
So. Canada has apparently pledged reductions of 23% by 2030. This is less ambitious than what Canada needs to do in the model for keeping below 1.5 °C heating by 2100, or even 2 °C. 29/
In fact, the only modelled scenario where Canada only reduces emissions by 23% by 2030 is the scenario where the world heats by 5.1 °C by 2100. Canada is not, according to these comparisons, pulling its weight. 30/
However, that is *not* the same thing as saying "if Canada only reduces emissions by the pledged 23% by 2030, the world will warm by 5.1 °C." 31/
Likewise, if Italy reduces emissions by 25% by 2030 as apparently pledged, it doesn't mean that the world will warm by 2.3 °C by 2100. 32/
It means that in their models, the scenario where Italy reduces emissions by 25% is the scenario where every country reduces emissions so that we suffer 2.3 °C of warming by 2100. 33/
Even if each country's emission targets are to some extent dependent on other countries' emissions, no single country can set the world on a 1.5 °C or 5.1 °C pathway. 34/
These numbers - Australia 4.4 °C, Egypt 3.3 °C, etc, are just a way of comparing countries' current reduction targets against a modelled way of dividing up emissions reductions. 35/
Why do they do this? It's one possible way of assessing relative progress if a lot of premises are accepted, but it doesn't seem like the best way of deciding what individual countries can do or need to do, or what is fair. 36/
But anyway, this is what gives them their Figure 4b: 37/

This figure was reproduced in the @guardian, with a new heading. 38/
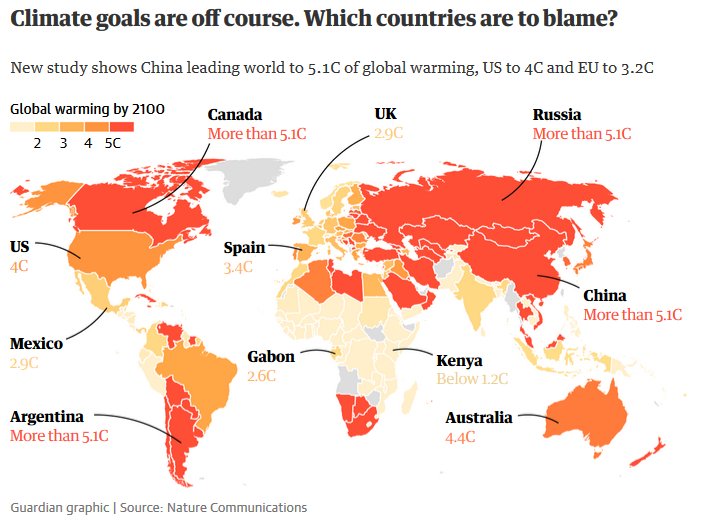
This graphic, especially as presented by the Guardian, lead us to think: bad Russia. Bad China. Bad Argentina. Bad Canada. Yet Western Europe and even the USA aren't doing too bad, huh? But this isn't what this graphic means. 39/
Incidentally, the models in this paper don't include emissions from land-use, land-use change, and forestry, and international shipping and aviation. So they're a long way from accurate *even* if you accept all the premises of the paper. 40/
And I haven't even touched upon the question of "offshoring" manufacturing emissions – the counting of those emissions in the country of manufacture rather than the country of consumption. 41/
(By the way, the fact that the authors of the paper describe making the minimum possible emissions reductions as "self-interest" is telling. What is in all of our self-interest right now is to cut emissions, fast, and stop terraforming the planet.) 42/
Ok, so that's the paper itself. Now, in its coverage, the @guardian – which is supposed to be you know, one of the good guys, is publishing statements like this: 43/
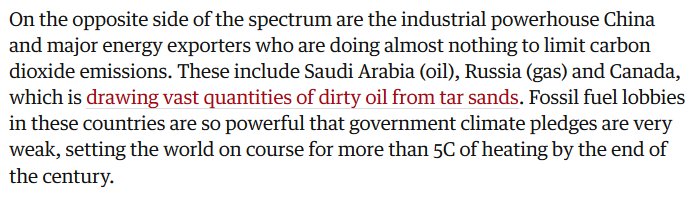
I don't know why this is included in the article, other than to try to provide explanations, however spurious, for what the graphic looks like. The paper doesn't say anything about specific sources of emissions, or the influence of fossil fuel lobbies in particular countries. 45/
The paper *also* doesn't say that if Saudi Arabia and Russia and Canada stick to their current pledges, the world will heat up by 5 °C by 2100. 46/
However, what the graphic and article tell Guardian readers is that the problem is *other* countries. We're doing great in Western Europe, but China's actions mean that temperature is going to increase by 5.1 °C. 47/
The graphic as presented implies that Germany (11.3 tons CO2 equivalent/capita in 2012) is putting us on course for 3 °C of warming by 2100 whereas Namibia (4.16 tons/capita) is sending us to 5.1 °C. This is misleading to the point of misinformation. 48/
(source for 2012 emissions figures: EDGAR database, GHG per capita emissions: edgar.jrc.ec.europa.eu/overview.php?v…) 48a/
I don't know whether China's, or any other country's, emissions reduction pledges are sufficient. But I do know that the published paper uses many assumptions that can be questioned and discussed and looked at differently. 49/
It looks like it's based on the first author's PhD thesis. It's definitely interesting work. But it also needs to be read and reported with a critical eye on its assumptions, methods and conclusions. 50/
Repeating this since it's the most important point in this thread: no one country can determine our heating trajectory. Each country can influence it up or down, and some countries are more important than others, but no one country can put us on a 1.5 °C or 5.1 °C pathway. 51/
I am really bugged by the way that this paper has been so badly reported by the Guardian. You can see a load of examples of how it's been received here on Twitter if you search: twitter.com/search?q=https… 52/
Unsurprisingly, people read the headline, see the graphic, skim the rather confusing text of the article itself, and conclude "China and Russia and Canada are screwing the world" and, often, "we're doomed". 53/
The article doesn't provide a proper understanding of the paper it's based on, and gives a misleading impression of countries' contributions to global warming. The writer is @jonathanwatts, Global Environment Editor, and I am sorry Jonathan but this article is not good. 54/
We need to make massive emissions reductions. That *especially* goes for us in rich countries. Getting distracted by bad science reporting is not going to help us. The media needs to stop publishing misleading articles, and we need to stop getting taken in by them. END.
PS Disclaimer: as I said, I'm not an economist or a climate scientist. I didn't understand everything in the paper and I'd be happy to be corrected on any of the above. But the main point, I think, stands: the paper does not say what the Guardian implies it does.


